EATME
Exponentially Weighted Moving Average with Adjustments to Measurement Error
The univariate statistical quality control tool aims to address measurement error effects when constructing exponentially weighted moving average p control charts. The method primarily focuses on binary random variables, but it can be applied to any continuous random variables by using sign statistic to transform them to discrete ones. With the correction of measurement error effects, we can obtain the corrected control limits of exponentially weighted moving average p control chart and reasonably adjusted exponentially weighted moving average p control charts. The methods in this package can be found in some relevant references, such as Chen and Yang (2022)
EATME
Overview
The statistical quality control tool aims to address measurement error effects when constructing exponentially weighted moving average p control charts. The method primarily focuses on binary random variables, but it can be applied to any continuous random variables by using sign statistic to transform them to discrete ones. With the correction of measurement error effects, we can obtain the corrected control limits of exponentially weighted moving average p control chart and reasonably adjusted exponentially weighted moving average p control charts.
Installation
You can install the released version of EATME from github
install.packages('EATME')
library(EATME)
Examples
This is an example which shows how find the control limits for two sided EWMA-p chart:
library(EATME)
#0.2 is the in-control probability
#0.05 is the smoothing parameter for EWMA chart
#5 is sample size
#1 is the correctness of true and false
#200 is ARL0
#10000 is the number of simulation for Monte Carlo method
#1 is the maximum error what we can allow between hat_ARL0 and ARL0
EWMA_p_two(0.2,0.05,5,1,1,200,10000,1)
#> $L1
#> [1] 2.319918
#>
#> $L2
#> [1] 2.223654
#>
#> $hat_ARL0
#> [1] 199.339
#>
#> $hat_MRL
#> [1] 131
#>
#> $hat_SDRL
#> [1] 210.7766
#>
#> $UCL
#> [1] 0.2664531
#>
#> $LCL
#> [1] 0.1363043
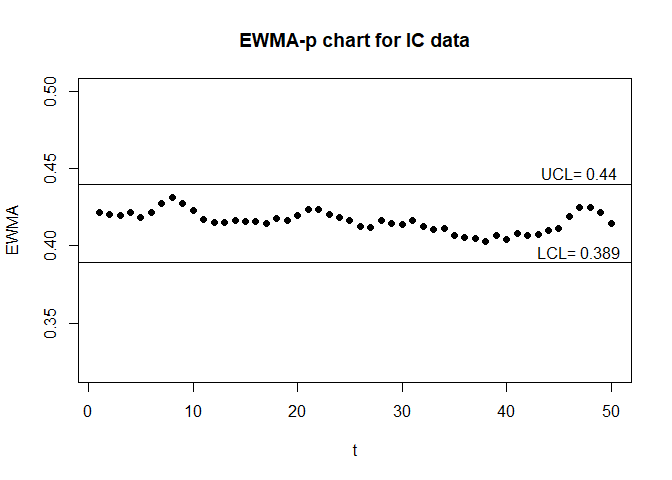
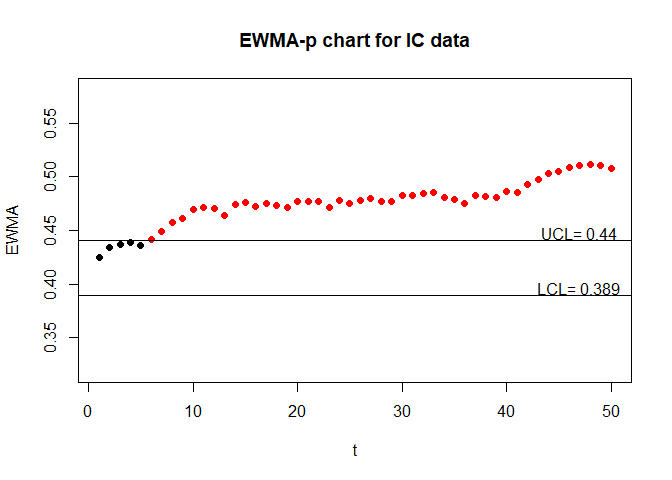
This is an example which shows how plot the two sided adjusted EWMA-p chart :
set.seed(6)
#We generate the discrete IC data with measurement error.
IC = ME_data_generate(0.4,50,50,0.9,0.9)
#We generate the discrete IC data with measurement error.
OC = ME_data_generate(0.5,50,50,0.9,0.9)
#The real EWMA-p chart
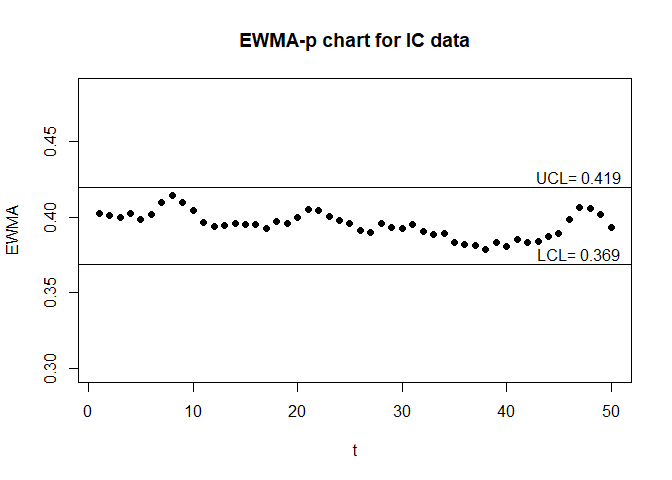
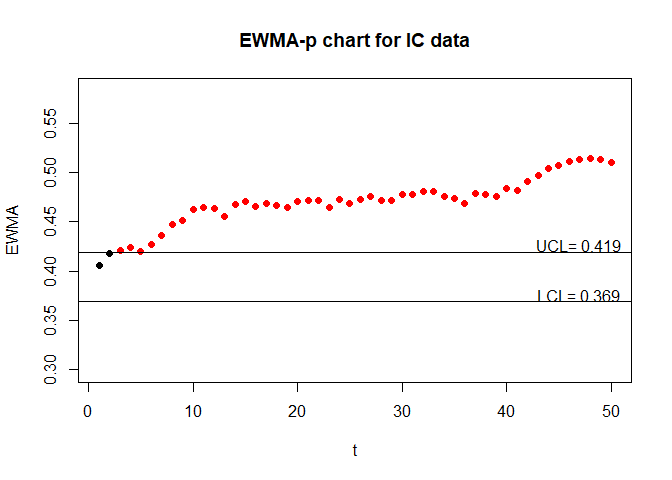
EWMA_p_chart_two(IC$real_data,OC$real_data,0.05,50,1,1)
#The unadjusted EWMA-p chart
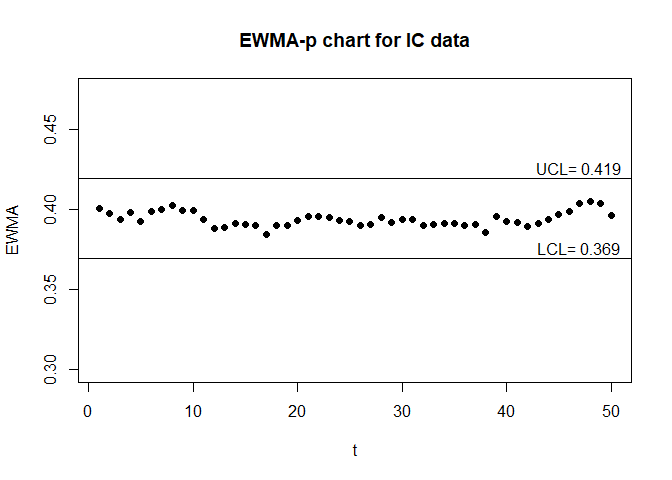
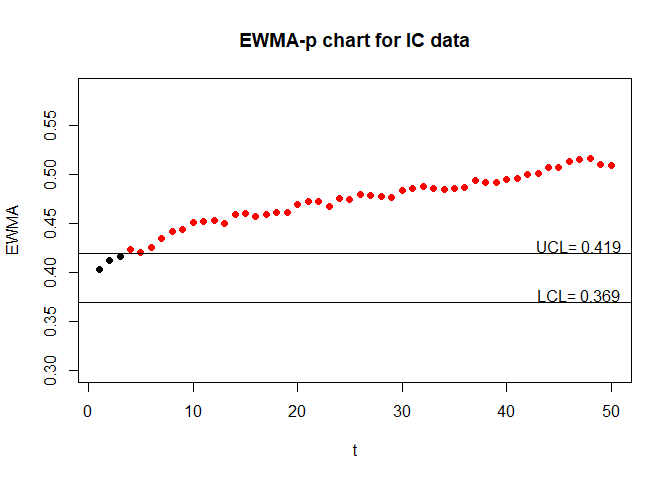
EWMA_p_chart_two(IC$obs_data,OC$obs_data,0.05,50,1,1)
#The adjusted EWMA-p chart
EWMA_p_chart_two(IC$obs_data,OC$obs_data,0.05,50,0.9,0.9)