Visualization of a Correlation Matrix

Provides a visual exploratory tool on correlation matrix that supports automatic variable reordering to help detect hidden patterns among variables.


R-CMD-check codecov.io CRAN Status CRAN Downloads

Summary

R package corrplot provides a visual exploratory tool on correlation matrix that supports automatic variable reordering to help detect hidden patterns among variables.

corrplot is very easy to use and provides a rich array of plotting options in visualization method, graphic layout, color, legend, text labels, etc. It also provides p-values and confidence intervals to help users determine the statistical significance of the correlations.

For examples, see its online vignette.

This package is licensed under the MIT license, and available on CRAN: https://cran.r-project.org/package=corrplot.

Basic example

library(corrplot)
M = cor(mtcars)
corrplot(M, order = 'hclust', addrect = 2)
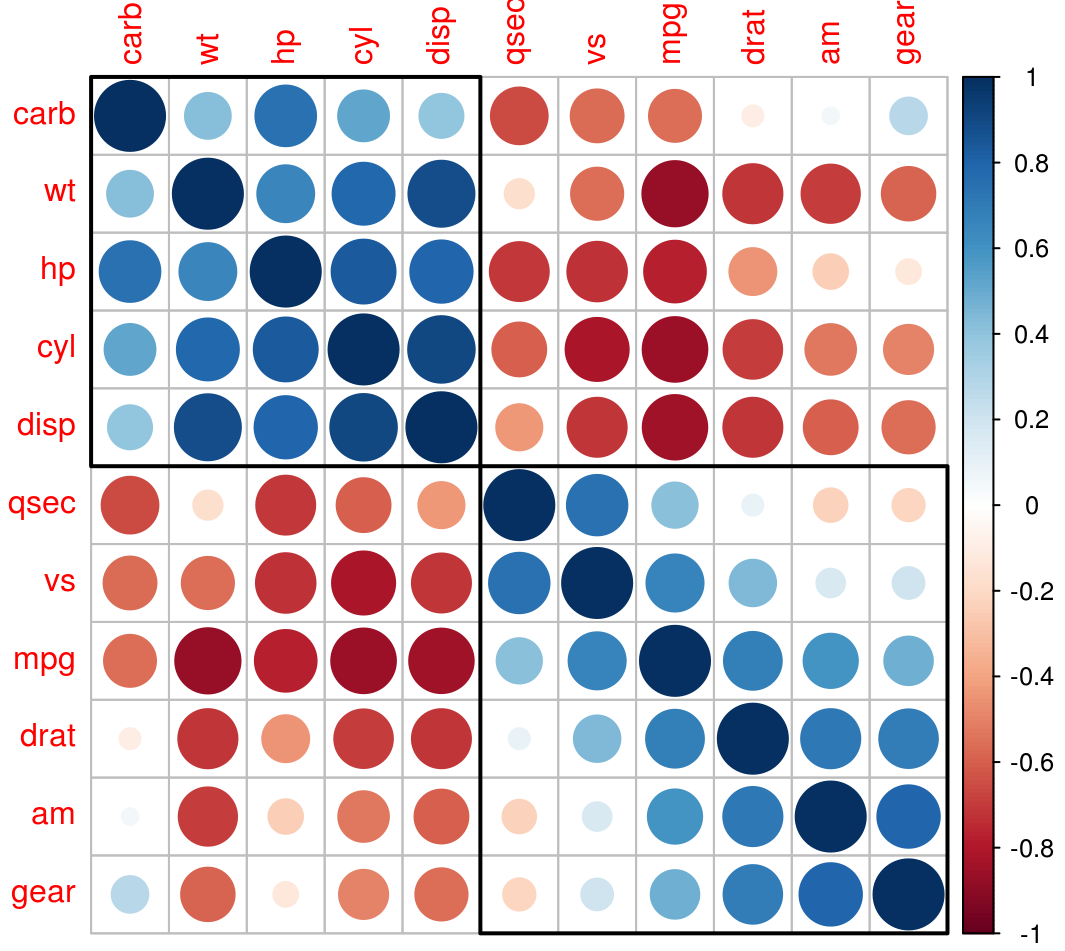
Basic example

Download and Install

To download the release version of the package on CRAN, type the following at the R command line:

install.packages('corrplot')

To download the development version of the package, type the following at the R command line:

devtools::install_github('taiyun/corrplot', build_vignettes = TRUE)

How to cite

To cite corrplot properly, call the R built-in command citation('corrplot') as follows:

citation('corrplot')

Reporting bugs and other issues

If you encounter a clear bug, please file a minimal reproducible example on github.

Reference manual

It appears you don't have a PDF plugin for this browser. You can click here to download the reference manual.

install.packages("corrplot")

0.95 by Taiyun Wei, 2 years ago


https://github.com/taiyun/corrplot


Report a bug at https://github.com/taiyun/corrplot/issues


Browse source code at https://github.com/cran/corrplot


Authors: Taiyun Wei [cre, aut] , Viliam Simko [aut] , Michael Levy [ctb] , Yihui Xie [ctb] , Yan Jin [ctb] , Jeff Zemla [ctb] , Moritz Freidank [ctb] , Jun Cai [ctb] , Tomas Protivinsky [ctb]


Documentation:   PDF Manual  


MIT + file LICENSE license


Suggests seriation, knitr, RColorBrewer, rmarkdown, magrittr, prettydoc, testthat


Imported by BNSP, BasketballAnalyzeR, CINNA, Correlplot, DGP4LCF, Dyn4cast, EMC2, EasyPCA, EcotoneFinder, ExPanDaR, GoodmanKruskal, ModelMap, MultiTraits, MultivariateAnalysis, NetworkToolbox, PLNmodels, Path.Analysis, PsychWordVec, RQdeltaCT, Rprofet, SLEMI, TestDimorph, adproclus, aslib, autoScorecard, bigtime, brsim, cases, climodr, coda4microbiome, compIndexBuilder, drought, dynRB, echarts4r, envar, fabMix, factorstochvol, frechet, grapesAgri1, jSDM, knobi, ldsep, linreg, mastif, metaGE, miceRanger, mixKernel, normalblockr, popstudy, rstatix, shinyr, visvaR.

Depended on by ClassificationEnsembles, LogisticEnsembles, NumericEnsembles, rQSAR, twl.

Suggested by AIDA, BGmisc, ClustImpute, DisaggregateTS, EpiQuestionR, FRESA.CAD, GGMncv, Guerry, HTLR, HVT, HawaSpatial, Hmsc, IOBR, JointAI, MetaNet, ModStatR, PRA, VisCollin, aridagri, artma, bakR, blox, boral, bullseye, camtrapR, candisc, colourvision, corrselect, dendextend, ecostats, facmodCS, facmodTS, fairmetrics, ggbiplot, ggpedigree, gllvm, harf, kergp, knitrBootstrap, mashr, mda.biber, missSBM, mpactr, multiocc, rattle, rmcorr, sageR, scov, textreg.


See at CRAN