dpcc
Dynamic Programming for Convex Clustering
Use dynamic programming method to solve l1 convex clustering with identical weights.
dpcc
dpcc aims to enable fast computation and path visualization of L1
convex clustering with identical weights.
Installation
You can install dpcc from GitHub with:
# install.packages("dpcc")
devtools::install_github("bingyuan-zhang/dpcc")
Load the packages.
library(dpcc)
Example
We first generate the three clusters example.
#install.packages("ggplot2")
library(ggplot2)
set.seed(12)
n = 50
error = matrix(rnorm(n*2,sd = 1.4),n,2)
which=sample(1:3, n, replace=TRUE)
xmean = matrix(rnorm(3*2,sd = 11),3,2)
tb1 = error + xmean[which,]
data = data.frame(
  x = scale(tb1[,1]),
  y = scale(tb1[,2]),
  clusters = factor(which)
)

ggplot(data,aes(x,y,color=factor(clusters))) +
  geom_point(size = 2, show.legend = FALSE)
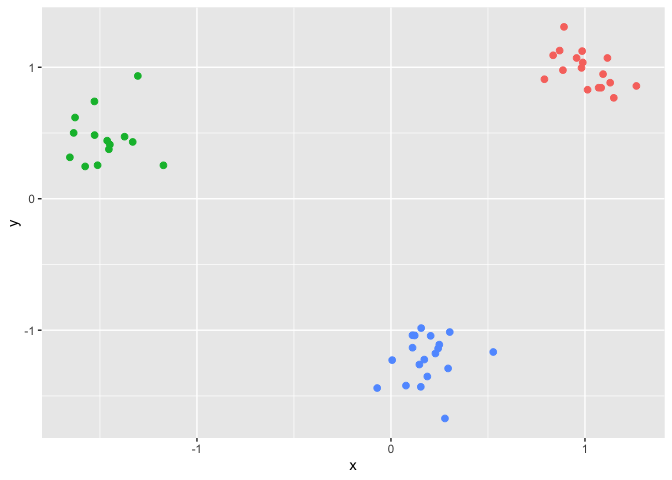 Now
we construct a sequence of tuning parameters with length K = 10.
Now
we construct a sequence of tuning parameters with length K = 10.
dat = data.matrix(data)[,1:2]
lam_max = find_lambda(dat)/1.5;
K = 10
Lam = sapply(1:K, function(i) i/K*lam_max)

Lam
#>  [1] 0.002726164 0.005452327 0.008178491 0.010904655 0.013630819 0.016356982
#>  [7] 0.019083146 0.021809310 0.024535474 0.027261637
Next we use the function in the package to draw the clusterpath.
res = cpaint(dat,Lam)
df.paths <- data.frame(x = dat[,1],y = dat[,2], group=1:n)
for (j in 1:K) {
  df <- data.frame(x=res[[1]][j,], y=res[[2]][j,], group=1:n)
  df.paths <- rbind(df.paths,df)
}

ggplot(data) +
  geom_path(data = df.paths, aes(x = x, y = y, group=group), colour='grey60', alpha = 0.5) +
  geom_point(aes(x = x, y = y, col = clusters), size = 2, show.legend = FALSE)
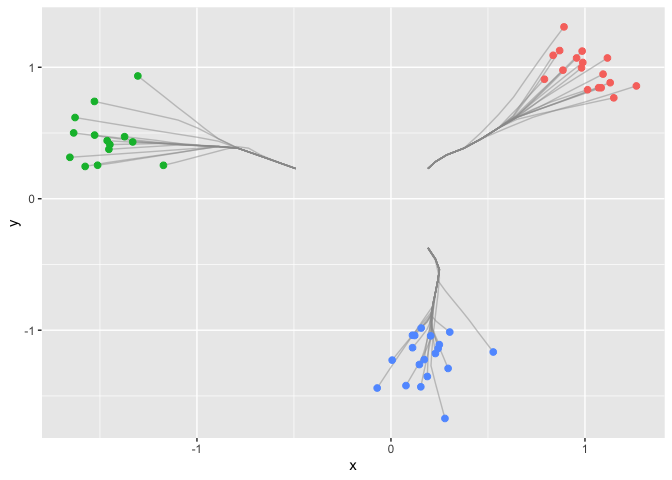
References
[1.] [Dynamic visualization for L1 fusion convex clustering in near-linear time] Bingyuan Zhang, Yoshikazu Terada, Jie Chen (UAI 2021 to appear).