gcor
Generalized Correlation and Related Measures
Generalized correlation and related measures for assessing nonlinear relationships between variables, including mixed-type data. For methodological background, see < https://r-suzuki.github.io/gcor/method.html>.
gcor package for R
gcor is an R package which provides tools for multivariate data analysis based on a generalized correlation measure.
It features a generalized version of (absolute) correlation coefficient
for arbitrary types of data, including both numerical and categorical
variables. Missing values can also be handled naturally by treating them
as observations of a categorical value NA.
Note that this project is in an early stage of development, so changes may occur frequently.
Installation
You can install the development version of gcor from
GitHub with pak:
# install.packages("pak")
pak::pak("r-suzuki/gcor-r")
or with devtools:
# install.packages("devtools")
devtools::install_github("r-suzuki/gcor-r")
Example
library(gcor)
Generalized correlation measure takes values in $[0,1]$, which can capture both linear and nonlinear relations.
When the joint distribution of $(X,Y)$ is bivariate normal, its theoretical value coincides with the absolute value of the correlation coefficient.
# Generalized correlation measure
gcor(iris)
#>              Sepal.Length Sepal.Width Petal.Length Petal.Width   Species
#> Sepal.Length    1.0000000   0.2349075    0.8846517   0.8741873 0.7718469
#> Sepal.Width     0.2349075   1.0000000    0.3143301   0.2669031 0.6591442
#> Petal.Length    0.8846517   0.3143301    1.0000000   0.9503289 0.8323583
#> Petal.Width     0.8741873   0.2669031    0.9503289   1.0000000 0.8339534
#> Species         0.7718469   0.6591442    0.8323583   0.8339534 1.0000000
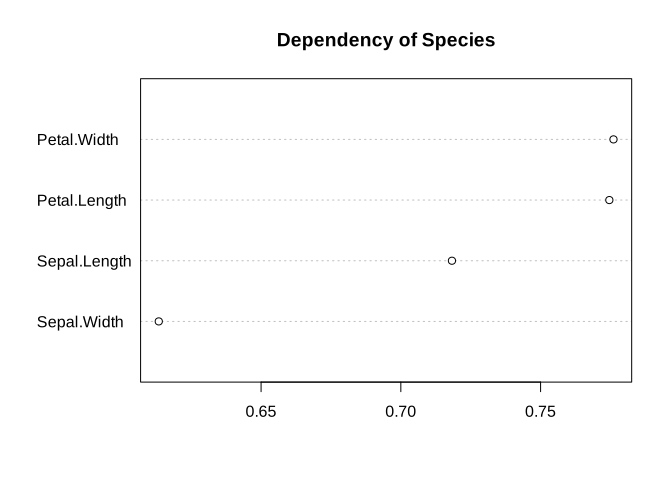
The directed generalized correlation is another variation of the generalized correlation. It also takes values in $[0,1]$, reaching $1$ when $Y$ is completely dependent on $X$ (i.e., when the conditional distribution $f(Y \mid X)$ is a one-point distribution) and $0$ when $X$ and $Y$ are independent.
# Dependency of Species on other variables
dgc <- dgcor(Species ~ ., data = iris)
dotchart(sort(dgc), main = "Dependency of Species")
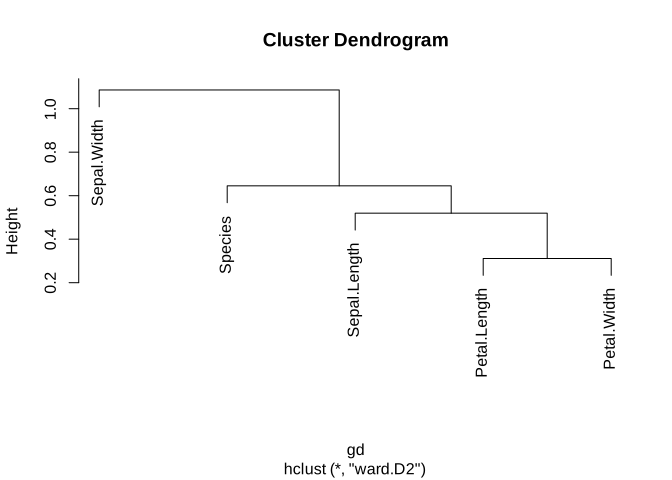
With $r_g$ as the generalized correlation between $X$ and $Y$, we can define a dissimilarity measure:
$$ d(X,Y) = \sqrt{1 - r^2_g} $$
It can be applied to cluster analysis:
# Clustering
gd <- gdis(iris)
hc <- hclust(gd, method = "ward.D2")
plot(hc)
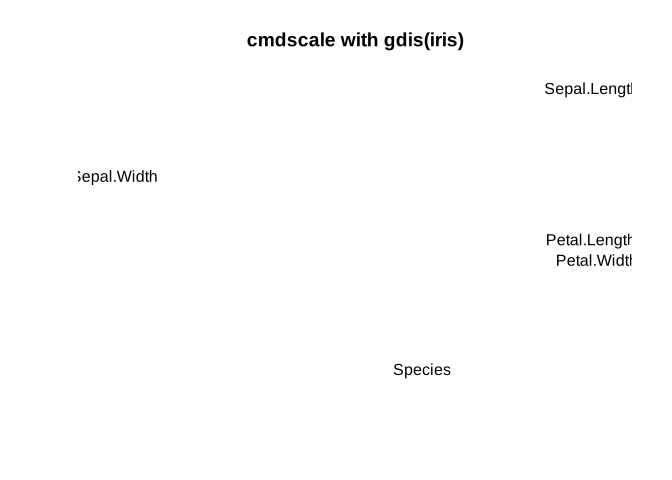
Multidimensional scaling would serve as a good example of an application:
# Multidimensional scaling
mds <- cmdscale(gd, k = 2)
plot(mds, type = "n", xlab = "", ylab = "", asp = 1, axes = FALSE,
     main = "cmdscale with gdis(iris)")
text(mds[,1], mds[,2], rownames(mds))