phylorug
Visualize Clade Recovery and Support Across Phylogenetic Trees
Generates rug plot visualizations directly on tree nodes to illustrate clade recovery and support from multiple phylogenetic and phylogenomic analyses. As modern studies routinely employ diverse datasets and inference techniques producing potentially conflicting trees, 'phylorug' simplifies the comparison among these trees by consolidating clade recovery and support on a reference tree.
phylorug 


phylorug is an R package for comparing and visualizing clade recovery and support across phylogenetic trees. It takes a set of trees from different inference pipelines, datasets, or statistical models, all representing the same focal group of organisms. phylorug draws a compact coloured grid, a rug plot, at each internal node of a reference tree, showing which clades are stable across trees and which are not. In presence mode, nodes recovered by all comparison trees appear as solid dots; in support mode, a dot means every comparison tree also rates the clade as very-high support. Contested or mixed-support nodes get a full rug plot showing each analysis individually.
Overview
Phylogenomic studies routinely apply multiple analytical approaches to infer relationships within a focal group of organisms. Different inference methods, datasets, and models yield trees that may differ in topology and report clade support using different metrics and formats. Assessing the robustness of phylogenetic results therefore requires comparing clade recovery and support across analyses, typically relative to a selected backbone tree.
A convenient way to visualize such comparisons is a phylogenetic rug plot, in which each node of the backbone tree is associated with a series of cells representing different analyses. Each cell indicates whether a clade was recovered and, where applicable, its level of support. Rug plots give an intuitive overview of clade stability across alternative phylogenetic analyses, but compiling them manually is tedious and time-consuming. Despite the extensive use of R in the phylogenetics community, no dedicated R package exists for generating such plots.
phylorug fills this gap. It operates in two modes:
Presence mode
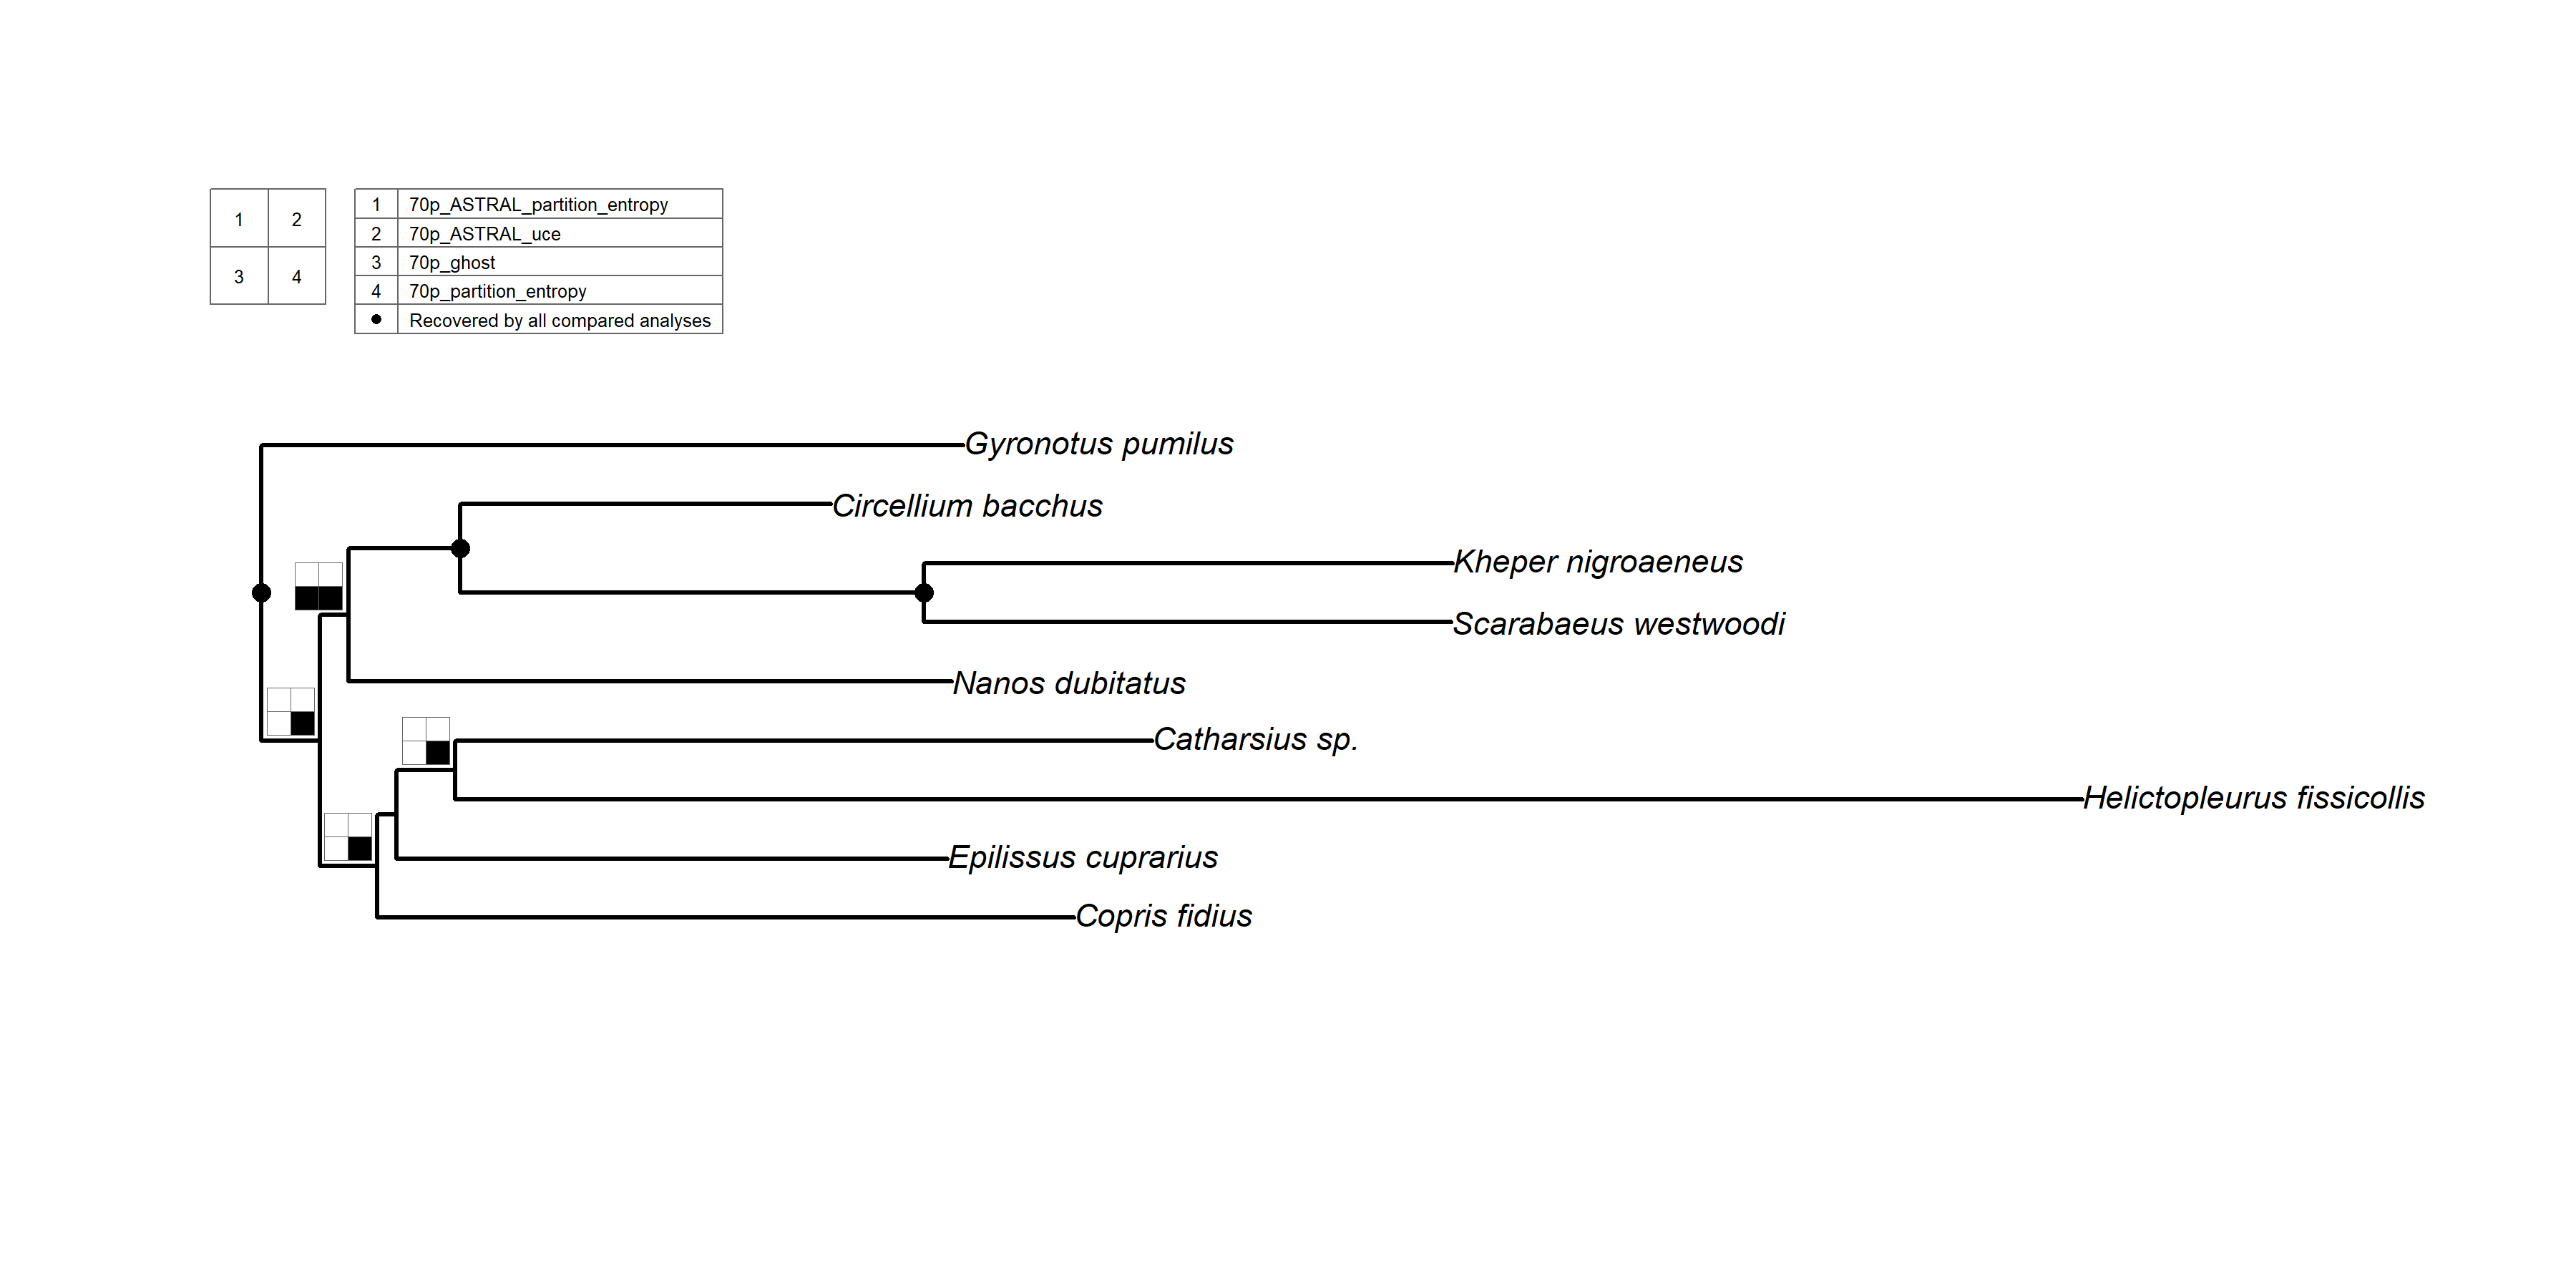 Presence mode rug plot on a 9-taxon
beetle subset
Black/white cells showing whether each analysis recovered a given clade or not. Stable nodes appear as black dots; contested nodes show a rug plot.
Support mode
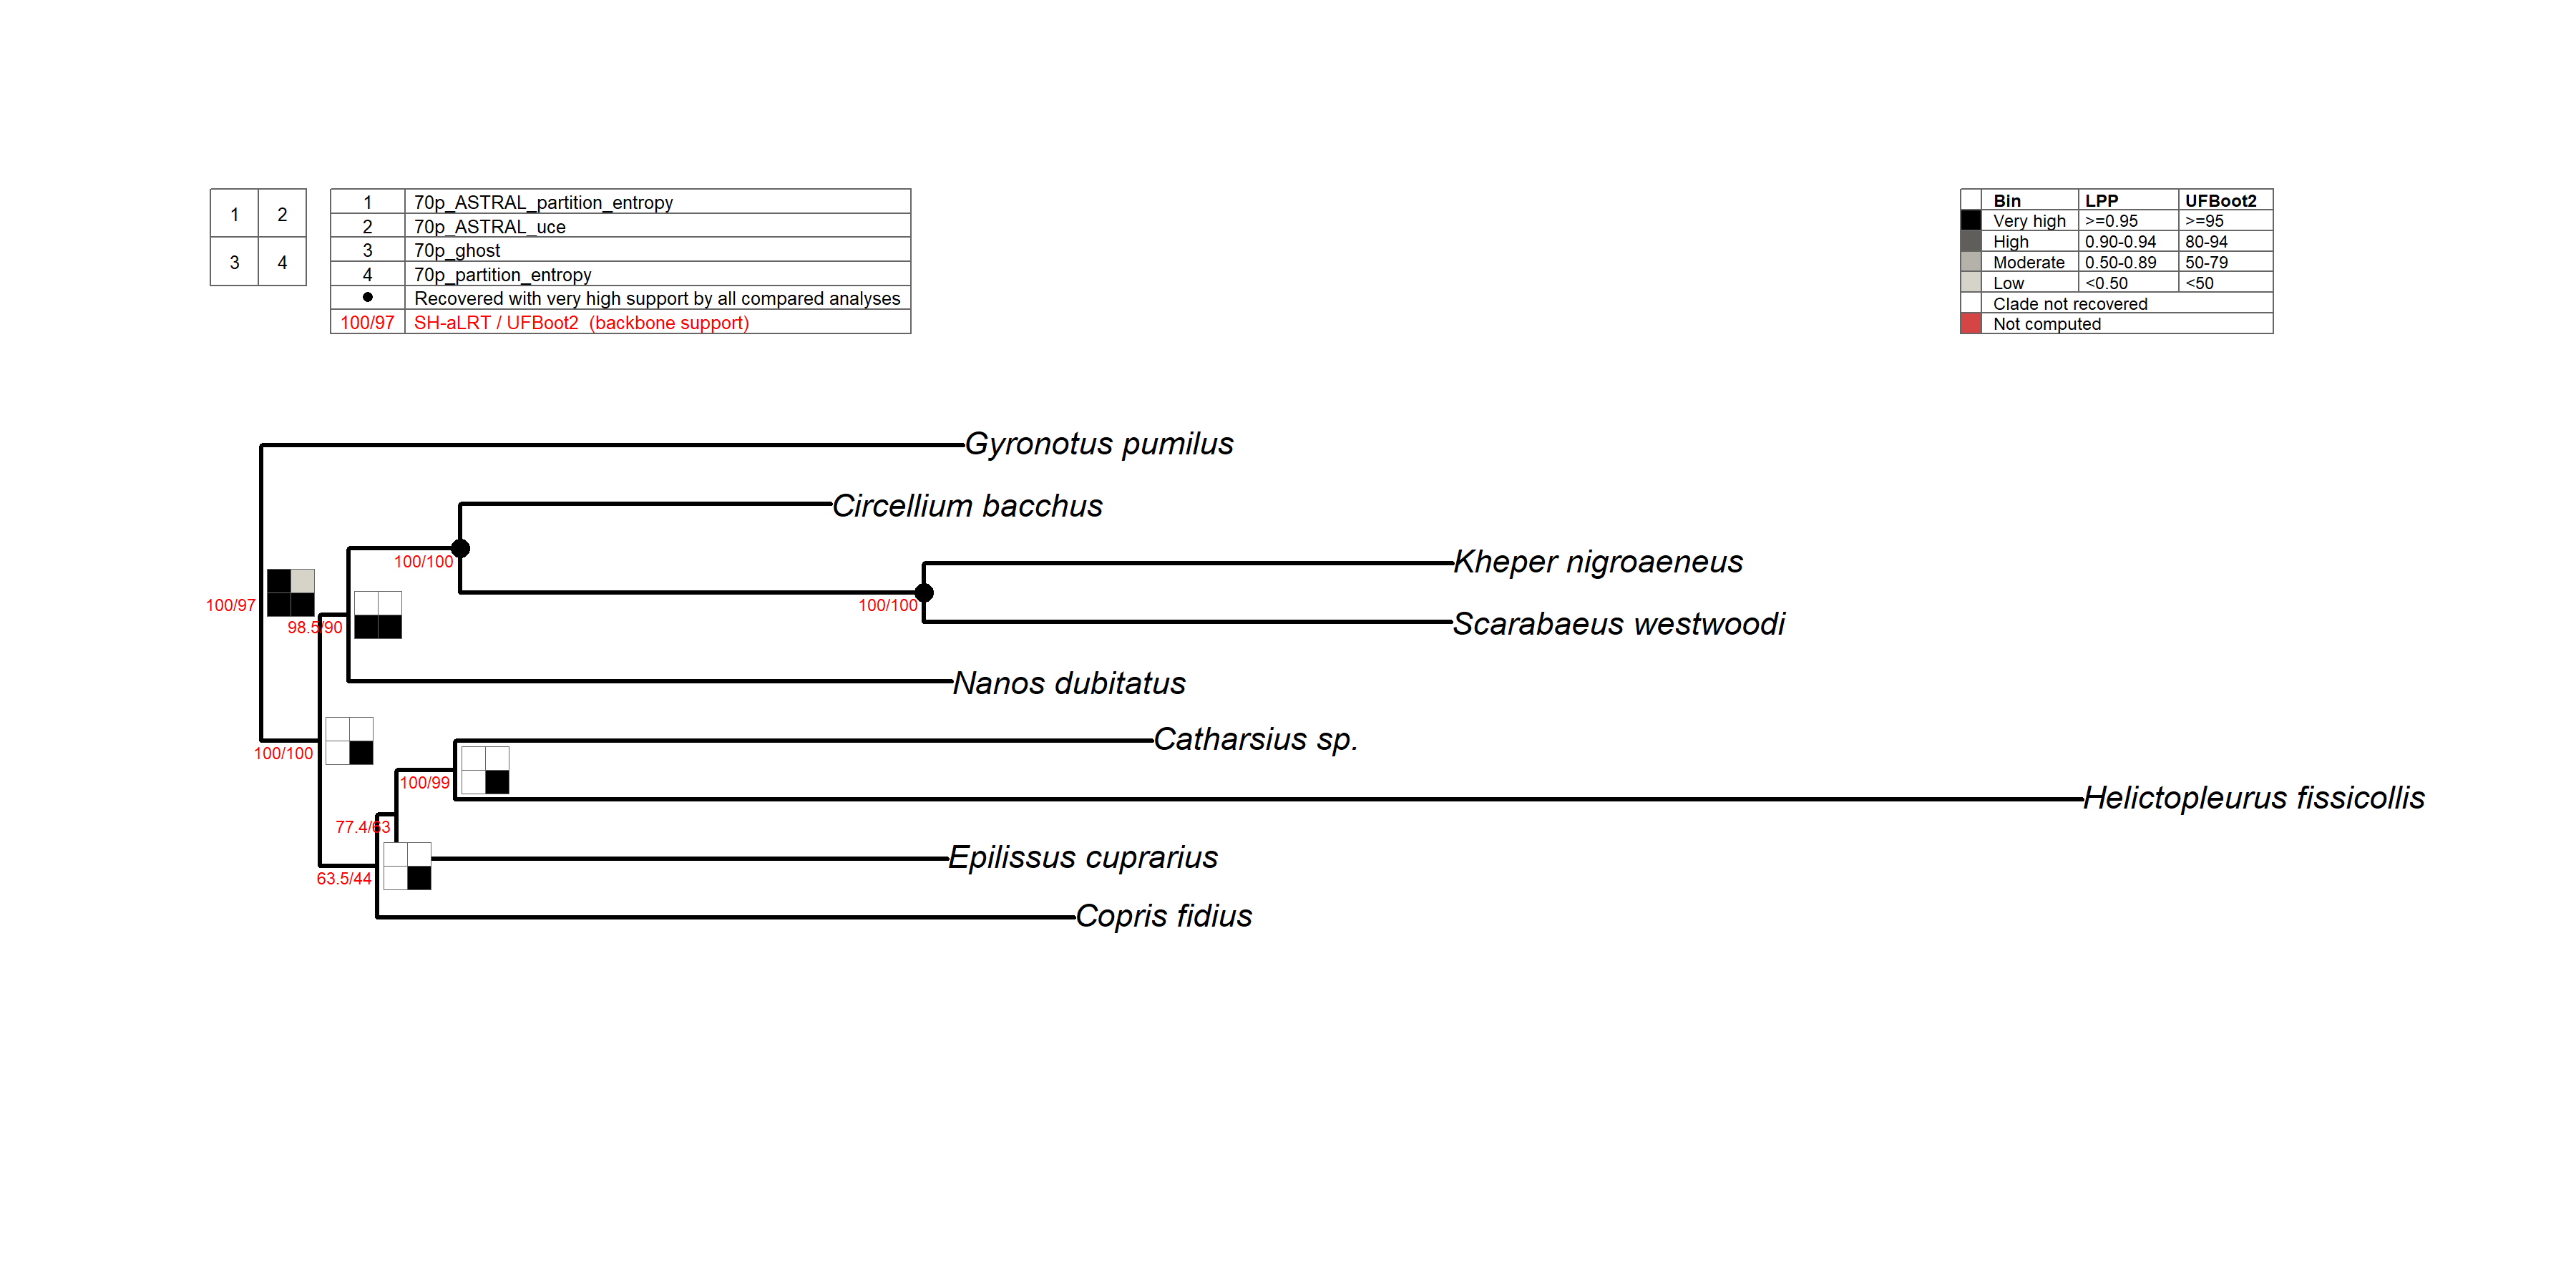 Cells are shaded in greyscale by
how strongly each analysis supports a given clade, from black (very
high) through progressively lighter greys to the lightest (low). White
means the clade was not recovered; red means it was recovered but
carries no support value. Each support value is binned against its own
metric’s thresholds, UFBoot2 95 and LPP 0.95 are never treated as
equivalent. Default thresholds are provided, but users are encouraged to
set their own.
In support mode a dot is stricter than in presence mode: it appears only
where every comparison analysis recovers the clade and rates it
very-high support. A clade recovered everywhere but with weaker or
missing support in even one analysis is drawn as a full rug plot
instead. Set dot_on_very_high = FALSE to draw a grid at every node.
The entire workflow runs in R, from reading raw tree files to publication-ready figures. The package was developed around a dung beetle phylogenomic dataset (Montanaro, Lopes et al. 2026) and includes three bundled datasets so users can try the pipeline on real data before applying it to their own.
Figures show a 9-taxon subset of sample_trees (tip labels cleaned)
for readability.
Installation
Install the released version of phylorug from CRAN:
install.packages("phylorug")
Or install the development version from GitHub:
# install.packages("pak")
pak::pak("mdrifathahamed/phylorug")
Quick example
library(phylorug)

# Load example trees from the package data
data(sample_trees)

# Select backbone and comparison trees
backbone <- sample_trees[["70p_uce"]]
others   <- sample_trees[names(sample_trees) != "70p_uce"]

# Check that all trees share the same set of taxa (recommended but optional)
check_taxa(backbone, others)

# Build the node presence matrix
# support_type only matters for support mode — skip it if you just want
# presence/absence
npm <- node_presence_matrix(backbone, others, support_col = 1, support_type = c(
                "70p_ASTRAL_partition_entropy" = "lpp",
                "70p_ASTRAL_uce"               = "lpp",
                "70p_ghost"                    = "ufboot",
                "70p_partition_entropy"        = "ufboot"))

# Presence mode: Which analyses recover each clade?
plot_phylorug(backbone, npm)

# Support mode: How strongly?
plot_phylorug(backbone, npm, mode = "support")
Core functions
phylorug provides seven functions that cover the full workflow from raw tree files to publication-ready figures:
read_trees()reads all Newick and Nexus tree files from a directory. So you don’t need to load each file individually.node_presence_matrix()builds the comparison matrix recording which clades are recovered by which analyses, along with their support values.plot_phylorug()draws the rug plot on a reference tree.
That is the basic pipeline: read -> matrix -> plot. Four additional helpers are available when your data needs them:
-
check_taxa()Validates that the backbone and comparison trees share an identical set of taxa, reporting any missing or extraneous tips. Use this diagnostic function betweenread_trees()andnode_presence_matrix()to pinpoint exact tip mismatches before the pipeline halts. -
translate_tips()Rename tip labels between naming conventions using a lookup table (e.g. specimen codes to species names). -
prune_to_shared()drops taxa that are not present in all trees, keeping only the shared set. Useful when comparison trees lack some taxa found in the backbone. -
add_tree()Appends new comparison trees directly to an existing node presence matrix (the object generated bynode_presence_matrix()) without requiring a complete recalculation of the pipeline.
You can learn more about each step in vignette("phylorug").
Dependencies
new
phylorug depends on ape and phangorn. No other external dependencies are required.
Additional features
- Handles compound IQ-TREE labels (e.g.
SH-aLRT/UFBoot2). User selects which slot to extract viasupport_colinnode_presence_matrix(), and controls what appears on the tree viashow_support_idxinplot_phylorug() - Treats a bare
"multiPhylo"as one analysis (a pool of tied-optimal trees). Whether a clade counts as present depends onpool_threshold:1.0(default) requires all pool trees to recover it (strict consensus),0.5requires a majority. - Supports both
"inside"and"outside"rug positioning relative to the tree - Backbone support values can be displayed alongside rug cells via
show_support - Unanimous nodes are collapsed to dots by default. In presence mode,
dot_identical = FALSEshows rug plots on every node. In support mode,dot_on_very_high = FALSEdoes the same, revealing support variation even at unanimous nodes - phylorug draws rug plot visualizations directly on the nodes of a reference phylogenetic tree, and lets users choose which nodes to visualize.
- Saves directly to PDF, PNG, or JPEG via the
fileargument.
Getting help
An overview of the package: ?phylorug
If you find a bug or have a feature request, please open an issue on GitHub.
Citation
If you use phylorug in a publication, please cite:
Ahamed, M.R., Arias, J.S., and Tarasov, S. (2026). phylorug: Visualize Clade Recovery and Support Across Phylogenetic Trees. R package version 0.1.0. https://github.com/mdrifathahamed/phylorug
Acknowledgements
This package was developed at the Finnish Museum of Natural History (LUOMUS) (https://www.helsinki.fi/en/luomus), University of Helsinki, as part of an MSc thesis in Ecology and Evolutionary Biology under the supervision of Sergei Tarasov and J. Salvador Arias.
The rug-plot concept traces to Wheeler (1995), was named “Navajo rugs” by Giribet (2003), and automated by Sanders (2010, Cladescan) and Machado (2015, YBYRÁ). phylorug extends this lineage into R and beyond parameter sensitivity to modern phylogenomic workflows.