MaddisonData
Maddison Project Data
Relatively easy access is provided to 2023 version of the Maddison project data downloaded 2025-08-28. This project collates all the credible data on population and GDP for 169 countries, with some dating back to the year 1 of the current era. One function makes it easy to find the leaders for each year, allowing users to delete countries like OPEC with narrow economies to focus on technology leaders. Another function makes it easy to plot data for only selected countries or years. Another function makes it relatively easy to obtain references to the original sources, which must be cited per the copyright rules of the Maddison Project for different uses of their data.
MaddisonData

Make it easier for humans to access data from the Maddison Data Project
in R. Later releases may include vignettes, etc., documenting analyses
using the [KFAS] (Kalman filtering and smoothing, aka state space)
techniques with these data.
Objectives: Make it relatively easy in R to do the following:
-
Find the countries with the highest
gdppcfor each year for which data are available usingMaddisonLeaders(). -
Refine “1” by deleting companies with high
gdppcbased on something narrow like a commodity, e.g., oil, since 1600:
library(MaddisonData)
MadDat1600 <- subset(MaddisonData, year>1600)
Leaders1600 <- MaddisonLeaders(c('ARE', 'KWT', 'QAT'), data=MadDat1600)
summary(Leaders1600)
#>     ISO yearBegin yearEnd   n         p
#> ARE ARE      1965    1984   5 0.2500000
#> AUS AUS      1853    1891  17 0.4358974
#> CHE CHE      1931    1934   4 1.0000000
#> GBR GBR      1808    1898  67 0.7362637
#> KWT KWT      1953    1957   5 1.0000000
#> LUX LUX      1991    1995   5 1.0000000
#> NLD NLD      1601    1807 207 1.0000000
#> NOR NOR      1996    2002   7 1.0000000
#> NZL NZL      1873    1874   2 1.0000000
#> QAT QAT      1950    2022  45 0.6164384
#> USA USA      1882    1990  58 0.5321101
- Plot the data available on
gdppcand / or pop for a selection of countries, e.g., world leaders.
str(GBR_USA <- subset(MaddisonData::MaddisonData, ISO %in% c('GBR', 'USA')))
#> Classes 'tbl_df', 'tbl' and 'data.frame':    1004 obs. of  4 variables:
#>  $ ISO  : chr  "GBR" "GBR" "GBR" "GBR" ...
#>  $ year : num  1 1000 1252 1253 1254 ...
#>  $ gdppc: num  NA 1151 1320 1328 1317 ...
#>  $ pop  : num  800 2000 NA NA NA NA NA NA NA NA ...
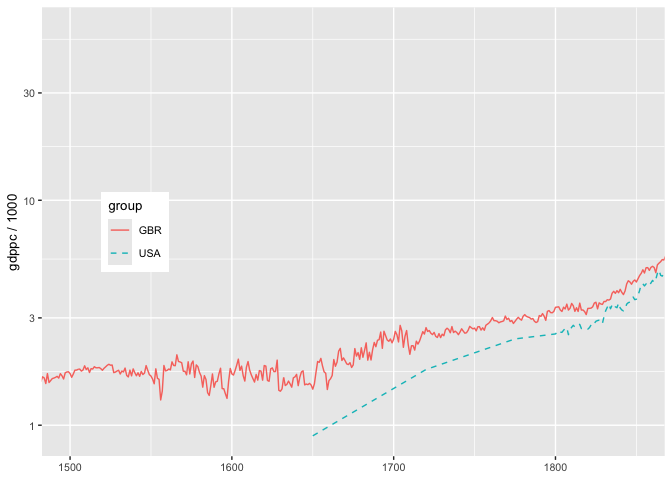
GBR_USA1 <- MaddisonData::ggplotPath('year', 'gdppc', 'ISO', GBR_USA, 1000)

GBR_USA1+ggplot2::coord_cartesian(xlim=c(1500, 1850)) # for only 1500-1850
GBR_USA1+ggplot2::coord_cartesian(xlim=c(1600, 1700), ylim=c(7, 17))
# label the lines
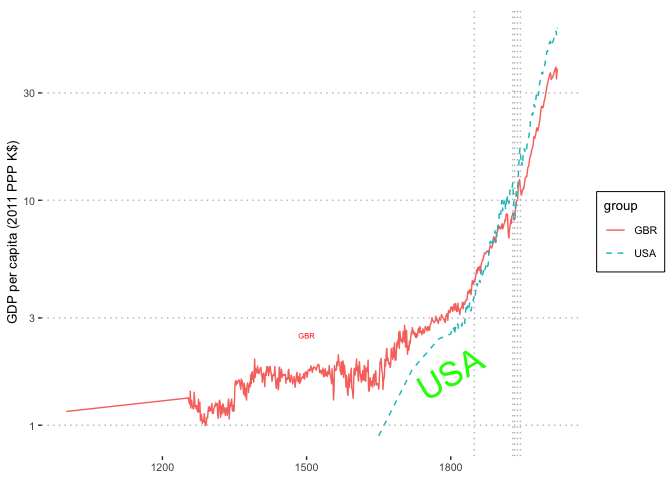
ISOll <- data.frame(x=c(1500, 1800), y=c(2.5, 1.7), label=c('GBR', 'USA'),
              srt=c(0, 30), col=c('red', 'green'), size=c(2, 9))
GBR_USA2 <- ggplotPath('year', 'gdppc', 'ISO', GBR_USA, 1000,
                    labels=ISOll, fontsize = 20)

# h, vlines, manual legend only
Hlines <- c(1,3, 10, 30)
Vlines = c(1849, 1929, 1933, 1939, 1945)
(GBR_USA3 <- ggplotPath('year', 'gdppc', 'ISO', GBR_USA, 1000,
       ylab='GDP per capita (2011 PPP K$)',
       legend.position = NULL, hlines=Hlines, vlines=Vlines, labels=ISOll))
LATER:
-
Build a state space / Kalman models for
gdppcandpopfor each country in the Maddison project data. -
Use Kalman smooth to interpolate and extrapolate (forward but not backwards)
gdppcandpopfor each country for all years that appear anywhere in the Maddison project data. -
Identify the world leader in
gdppcfor each year, refining “1” usingKFASinterpolation. -
Identify the world technology leader for each year by evaluating the
gdppcleader for each year and replacing any whose leadership was narrow like members of OPEC with a country with a broad-based economy like the US.
Installation
You can install the development version of MaddisonData from GitHub with:
# install.packages("pak")
pak::pak("sbgraves237/MaddisonData")
Example
[Coming soon.]
library(MaddisonData)
## basic example code