actiplot
Plotting Minute-Level Activity Data
Provides 'ggplot2' plots for minute-level activity data,
including step counts and activity counts. Time series can be displayed
over the full recording period or aligned by time of day and
faceted into one row per date. Includes example activity data
described by Chadwell et al. (2019)


actiplot
actiplot provides ggplot2 visualizations for minute-level activity
data, including steps and activity counts. It works with the
standardized timestamp conventions used throughout the activerse.
Example-data provenance
acti_minute_data is a processed minute-level recording drawn from the
Figshare collection of upper-limb activity
data from 20 myoelectric
prosthesis users and 20 anatomically intact adults. Please cite the
original data descriptor when using it: Chadwell A, Kenney L, Granat M,
Thies S, Galpin A, and Head J (2019), Upper limb activity of twenty
myoelectric prosthesis users and twenty healthy anatomically intact
adults, Scientific Data
6, 199.
Core entry points:
acti_plot_time()for a complete activity time seriesacti_plot_day()for time-of-day-aligned daily rowsacti_plot_heatmap()for a date-by-time activity heat map
Installation
You can install actiplot from GitHub with:
# install.packages("remotes")
remotes::install_github("jhuwit/actiplot")
Quick start
activity <- acti_minute_data[seq_len(1440), ]

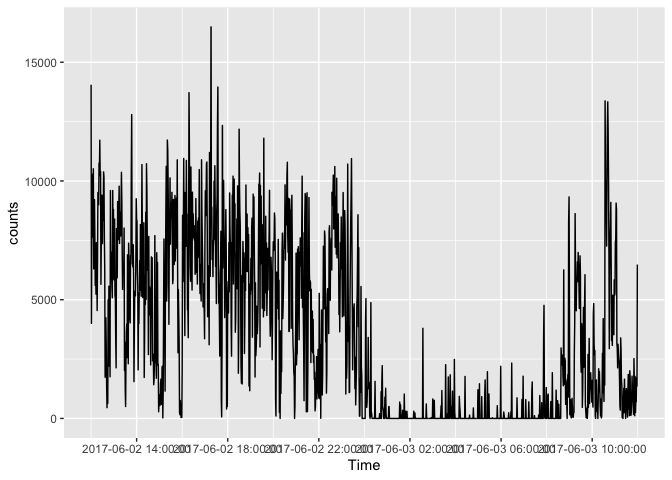
acti_plot_time(activity, counts, breaks = "4 hours")
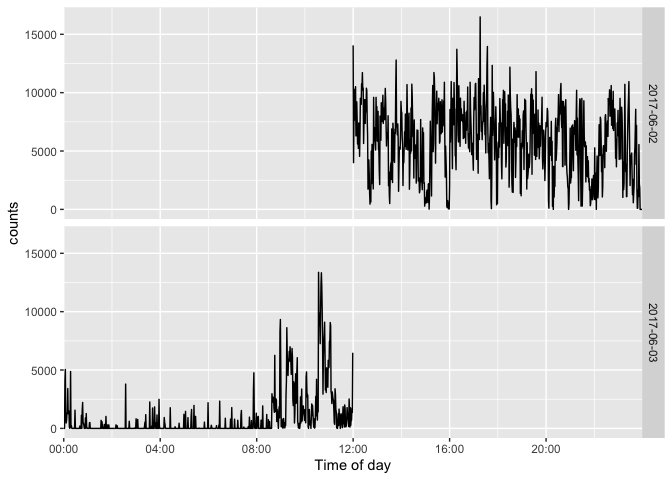
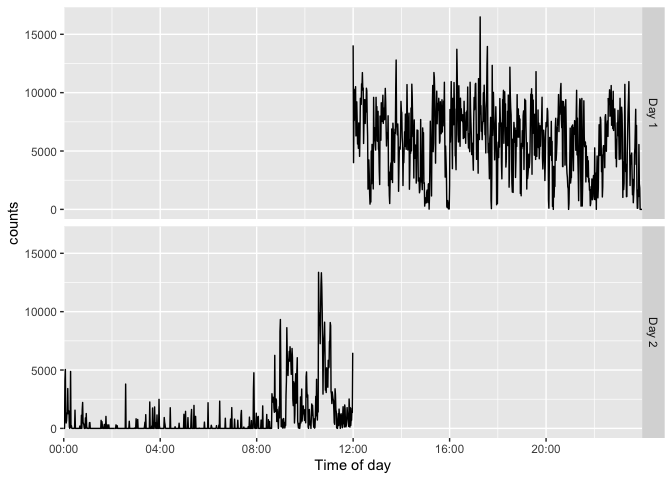
acti_plot_day(activity, counts, breaks = "4 hours")
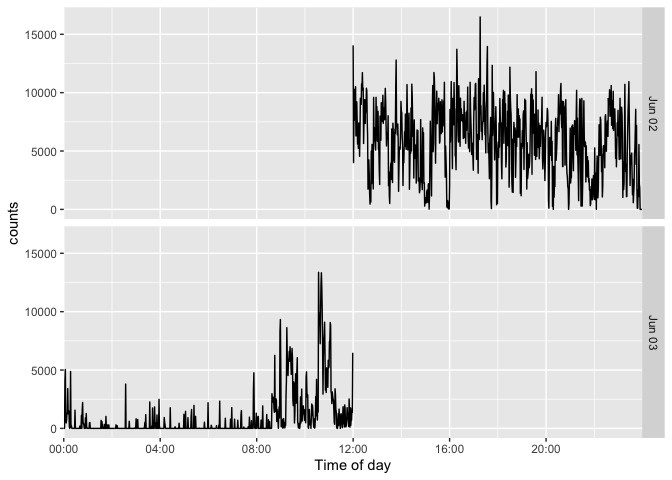
Daily facets can use a compact month-and-day label or baseline-relative
day numbers: facet = "month-day" and facet = "day", respectively.
acti_plot_day(activity, counts, facet = "month-day")
acti_plot_day(activity, counts, facet = "day")
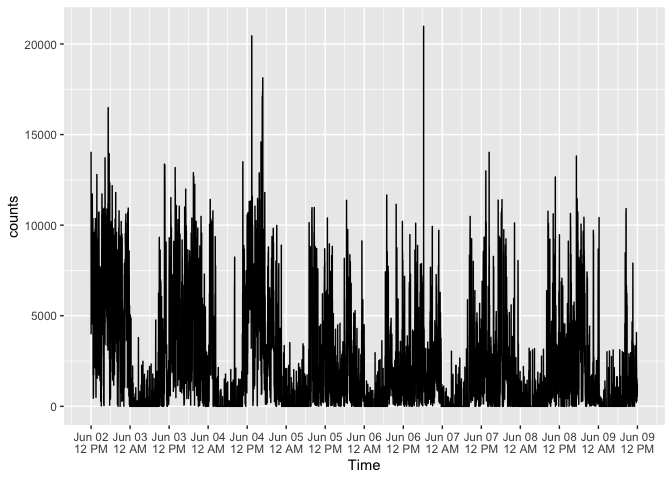
For a complete recording, x_axis = "12 hours" labels midnight and noon
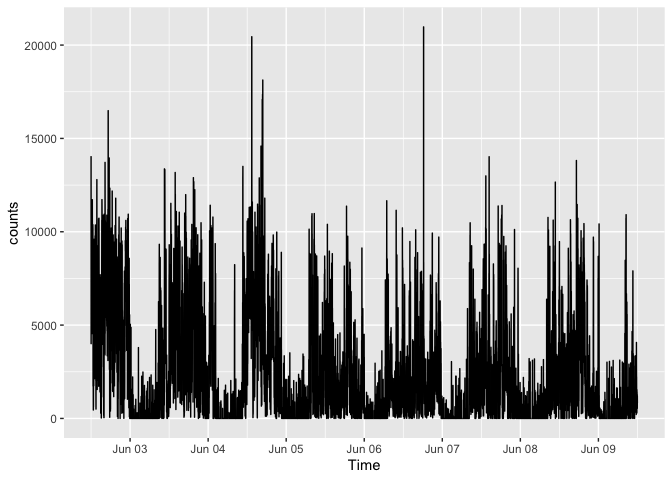
with both the date and a 12-hour clock. Use x_axis = "midnight" when a
date-only label at midnight is preferred.
acti_plot_time(acti_minute_data, counts, x_axis = "12 hours")
acti_plot_time(acti_minute_data, counts, x_axis = "midnight")
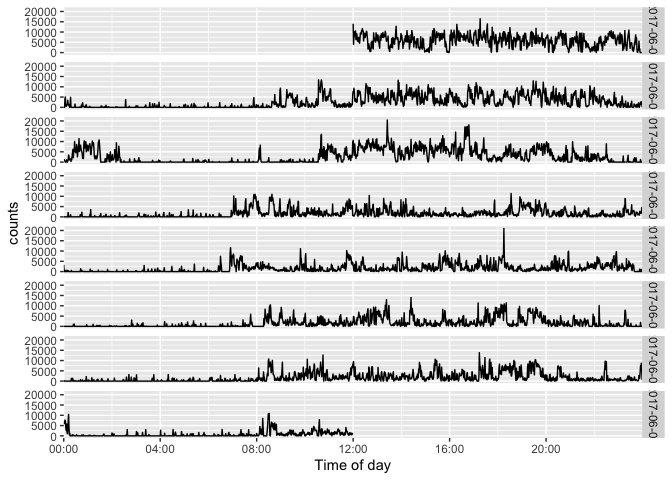
acti_plot_day(acti_minute_data, counts, breaks = "4 hours")