bruneimap
Maps and Spatial Data of Brunei
Provides spatial data for mapping Brunei, including boundaries for districts, mukims, and kampongs, as well as locations of key infrastructure such as masjids, hospitals, clinics, and schools. The package supports researchers, analysts, and developers working with Brunei’s geographic and demographic data, offering a quick and accessible foundation for creating maps and conducting spatial studies.
bruneimap

Provides Brunei GIS data in the form of a sf (simple features) object
ready for plotting and analysis in R. The smallest (areal) unit of
analysis is a “kampong” (although not all areas are actual kampongs),
which in turn is contained within mukims and districts.
Installation
You can install the development version of bruneimap from GitHub with:
# install.packages("pak")
pak::pkg_install("propertypricebn/bruneimap")
Features
There are three sf files contained in the package:
dis_sf(District level boundaries)mkm_sf(Mukim level boundaries)kpg_sf(“Kampong” level boundaries)
Most likely you will want to use either the kampong level or mukim level data.
Data
# Load libraries
library(tidyverse)
theme_set(theme_bw())
library(bruneimap)
library(sf)

# What's in our data set?
glimpse(kpg_sf)
#> Rows: 438
#> Columns: 9
#> $ id        <dbl> 1, 2, 3, 4, 5, 6, 7, 8, 9, 10, 11, 12, 13, 14, 15, 16, 17, 1…
#> $ kampong   <chr> "Kg. Biang", "Kg. Amo", "Kg. Sibut", "Kg. Sumbiling Baru", "…
#> $ mukim     <chr> "Mukim Amo", "Mukim Amo", "Mukim Amo", "Mukim Amo", "Mukim A…
#> $ district  <chr> "Temburong", "Temburong", "Temburong", "Temburong", "Temburo…
#> $ geometry  <POLYGON [°]> POLYGON ((115.1546 4.66665,..., POLYGON ((115.1626 4…
#> $ X         <dbl> 115.1244, 115.1512, 115.1080, 115.1071, 115.1600, 115.1247, …
#> $ Y         <dbl> 4.666180, 4.631506, 4.611763, 4.597677, 4.574173, 4.587969, …
#> $ perimeter [m] 21056.211 [m], 38683.611 [m], 16291.051 [m], 12994.328 [m], 33…
#> $ area      [m^2] 19281117.5 [m^2], 52037879.4 [m^2], 7597654.2 [m^2], 6652565…
Plots
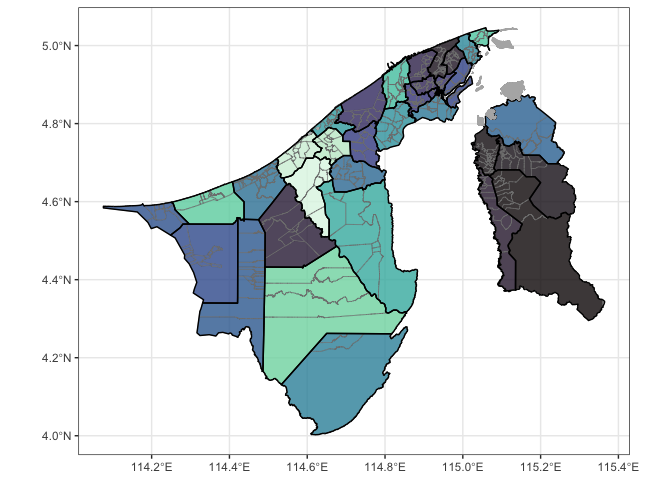
ggplot(kpg_sf) +
  geom_sf(aes(fill = mukim), col = "gray50", alpha = 0.8) +
  geom_sf(data = mkm_sf, col = "black", lwd = 0.5, fill = NA) +
  geom_sf(data = dplyr::filter(kpg_sf, is.na(mukim)), fill = "gray70", col = "gray70") +
  theme(legend.position = "none") +
  scale_fill_viridis_d(option = "mako")
Acknowledgements
The Brunei map was generated from publicly available Survey Department data. The GeoJSON files were sourced from thewheat/brunei_map GitHub repo. It comes with a neat web app. Many thanks to these guys!
Contributors
All contributions to this project are gratefully acknowledged using the
allcontributors package
following the all-contributors
specification. Contributions of any kind are welcome!

nrirdnbtrsy |

haziqj |

alvinbjl |

Angela-29 |

SyafYus |

Dwaaz |

HafeezulRaziq |

ANajwa-20 |

nswaaan |

MrJaZzi |

Syfii |