bumbl
Tools for Modeling Bumblebee Colony Growth and Decline
Bumblebee colonies grow during worker production, then
decline after switching to production of reproductive individuals
(drones and gynes). This package provides tools for modeling and
visualizing this pattern by identifying a switchpoint with a growth
rate before and a decline rate after the switchpoint. The mathematical
models fit by bumbl are described in Crone and Williams (2016)
Tools for modeling bumblebee colony growth




bumbl implements a model for bumblebee colony growth described in
Crone and Williams 20161. It models colony growth as having a
switchpoint at some time, tau, where the colony switches from growth
and worker production to gyne production and decline. Currently
bumbl() works by fitting a separate switchpoint model to each colony,
optimizing the switchpoint, tau. It returns the optimal switchpoint,
growth, and decline rates for each colony. Because the current version
of bumbl() works by fitting a separate GLM to each colony, if
covariates are included, their estimates could vary significantly among
colonies. Stay tuned for future developments that may allow estimating a
single value of a covariate but different values of growth and decline
rates and tau for each colony.
Contributing
I’m looking for collaborators who know (or are willing to let me teach them) how to use git and GitHub and who have an interest in taking over as maintainer of this package. I’m not a bumblebee biologist, so I would especially love a collaborator who works on bumblebees or other organisms with a similar growth, switch, decline lifecycle.
I also welcome contributions including bug-fixes, improvement of documentation, additional features, or new functions relating to bumblebee ecology and demography from anyone!
Roadmap
- [x] Write
bumbl()function to model colony growth with switchpoint - [x] Finish documentation and vignette(s)
- [x] rOpenSci review
- [x] Regroup with Elizabeth Crone to discuss current behavior of
bumbl() - [x] Release v0.1.0 and archive on Zenodo
- [x] Bug fixes
- [x] Submit v1.0.0 of package to CRAN
- [x] Write a manuscript for JOSS (desk-reject, out of scope)
- [x] Release minor version to CRAN to update citation
- [ ] Possibly re-work internals of
bumbl()? (see #58 and notes) - [ ] Submit v2.0.0 of package to CRAN
Other possible areas of improvement:
- Extend
bumbl()to work with GLMMs - Test significance of switchpoint (see #62)
- Extend
bumbl()to work with dates, datetimes, or other timeseries classes (see #46)
Installation
You can install bumbl with:
install.packages("bumbl")
Or install the development version with:
devtools::install_github("Aariq/bumbl", build_vignettes = TRUE)
Getting started
View the package vignette with:
library(bumbl)
vignette("bumbl")
View the bomubs dataset
head(bombus)
#> # A tibble: 6 × 10
#>   site  colony  wild habitat date        week  mass d.mass floral_resources
#>   <fct> <fct>  <dbl> <fct>   <date>     <int> <dbl>  <dbl>            <dbl>
#> 1 PUT2  9       0.98 W       2003-04-03     0 1910.    0.1            27.8
#> 2 PUT2  9       0.98 W       2003-04-09     1 1940    30.6            27.8
#> 3 PUT2  9       0.98 W       2003-04-15     2 1938    28.6            27.8
#> 4 PUT2  9       0.98 W       2003-04-22     3 1976.   67.1            27.8
#> 5 PUT2  9       0.98 W       2003-05-01     4 2010.  101.              7.96
#> 6 PUT2  9       0.98 W       2003-05-07     5 2143   234.              7.96
#> # ℹ 1 more variable: cum_floral <dbl>
Example use
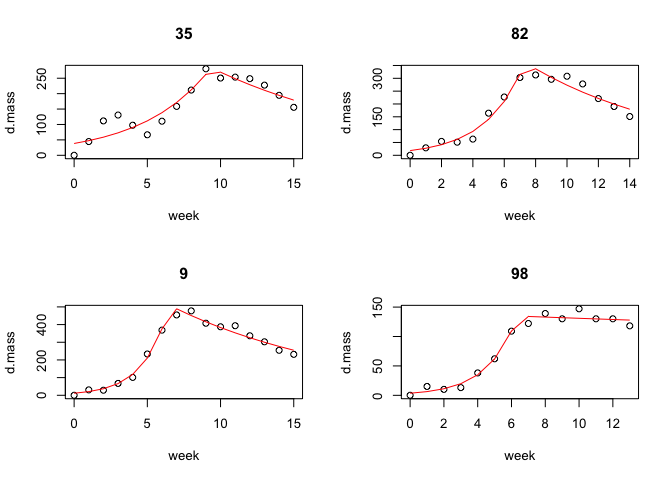
Using a subset of the bombus dataframe to estimate the week (tau) that
colonies switch to reproduction
bombus2 <- bombus[bombus$colony %in% c(9, 82, 98, 35), ]
results <- bumbl(bombus2, colonyID = colony, t = week, formula = d.mass ~ week)
results
#> # A tibble: 4 × 7
#>   colony converged   tau logN0 logLam  decay logNmax
#>   <chr>  <lgl>     <dbl> <dbl>  <dbl>  <dbl>   <dbl>
#> 1 35     TRUE       9.37  3.65  0.214 -0.296    5.60
#> 2 82     TRUE       7.34  2.91  0.407 -0.512    5.82
#> 3 9      TRUE       6.52  2.45  0.579 -0.660    6.19
#> 4 98     TRUE       6.37  1.27  0.570 -0.578    4.90
Plot the results
par(mfrow = c(2, 2))
plot(results)
#> Creating plots for 4 colonies...
par(mfrow = c(1, 1))
References
1Crone, E. E., and Williams, N. M. (2016). Bumble bee colony dynamics: quantifying the importance of land use and floral resources for colony growth and queen production. Ecol. Lett. 19, 460–468. https://doi.org/10.1111/ele.12581
Please note that the bumbl project is released with a Contributor
Code of
Conduct.
By contributing to this project you agree to abide by its terms.