rescomp
Efficient Modelling of Resource Competition
Generate, simulate and visualise ODE models of consumer-resource interactions. At its core, 'rescomp' provides a resource competition modelling focused interface to 'deSolve', alongside flexible functions for visualising model properties and dynamics. More information, documentation and examples can be found on the package website.
rescomp

rescomp is an R package that supports the definition, simulation and visualisation of ODE models of ecological consumer-resource interactions. In essence, it is a consumer-resource modelling focused interface to the excellent deSolve package.
Installation
You can install rescomp from GitHub with:
# install.packages("devtools")
devtools::install_github("pyrrhicpachyderm/rescomp")
Example
library(rescomp)
The primary user function in rescomp is spec_rescomp(), which
facilitates: i) the definition and parameterisation of a desired
consumer-resource model, and ii) the specification of simulation
parameters. The default output from spec_rescomp() is a list defining
a model for a single type I consumer (linear functional response) and a
single continuously supplied resource (e.g., in a chemostat).
pars <- spec_rescomp()
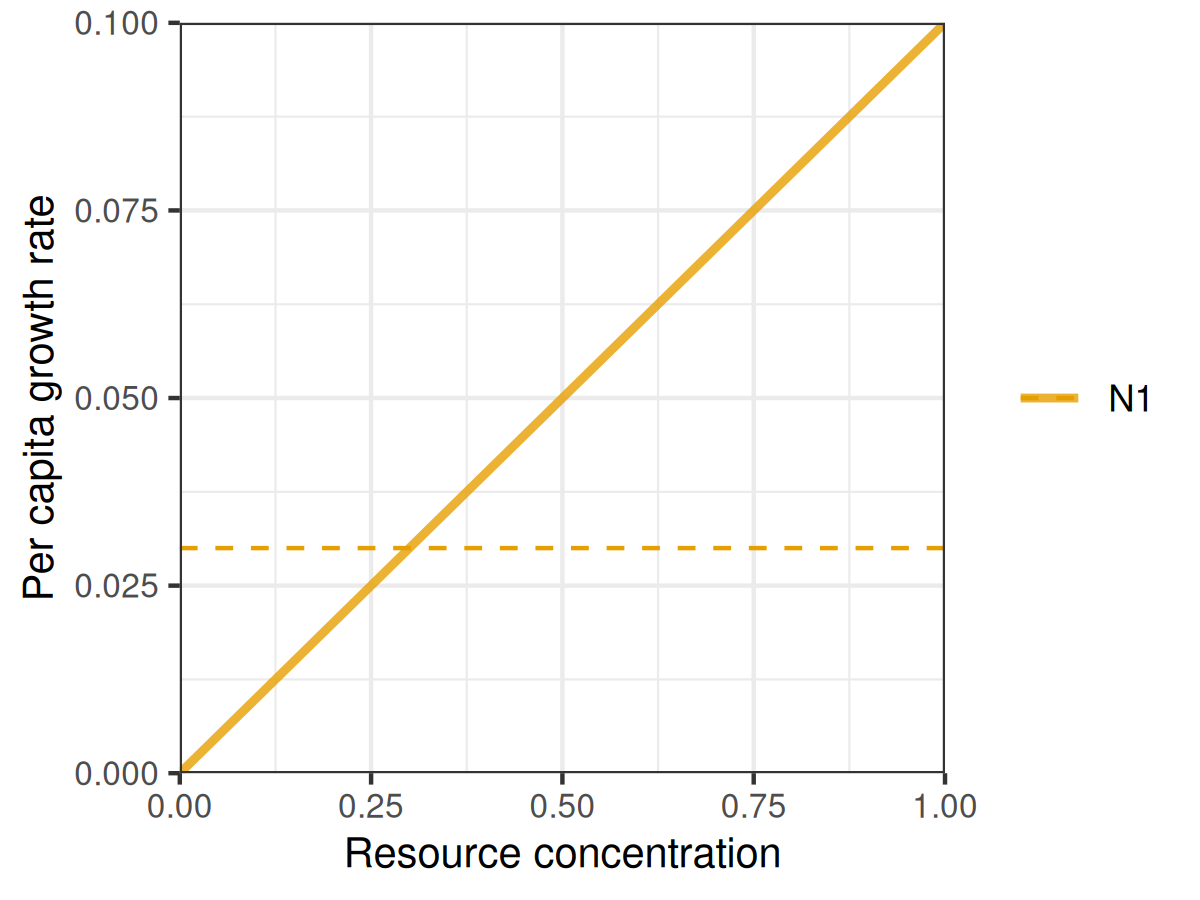
plot_funcresp() plots the functional response for easy visualistion
prior to running a simulation.
plot_funcresp(pars)
The model is then simulated via sim_rescomp() (effectively a wrapper
for deSolve::ode() with convenient defaults).
m1 <- sim_rescomp(pars)
Output dynamics can be visualised with plot_rescomp().
plot_rescomp(m1)
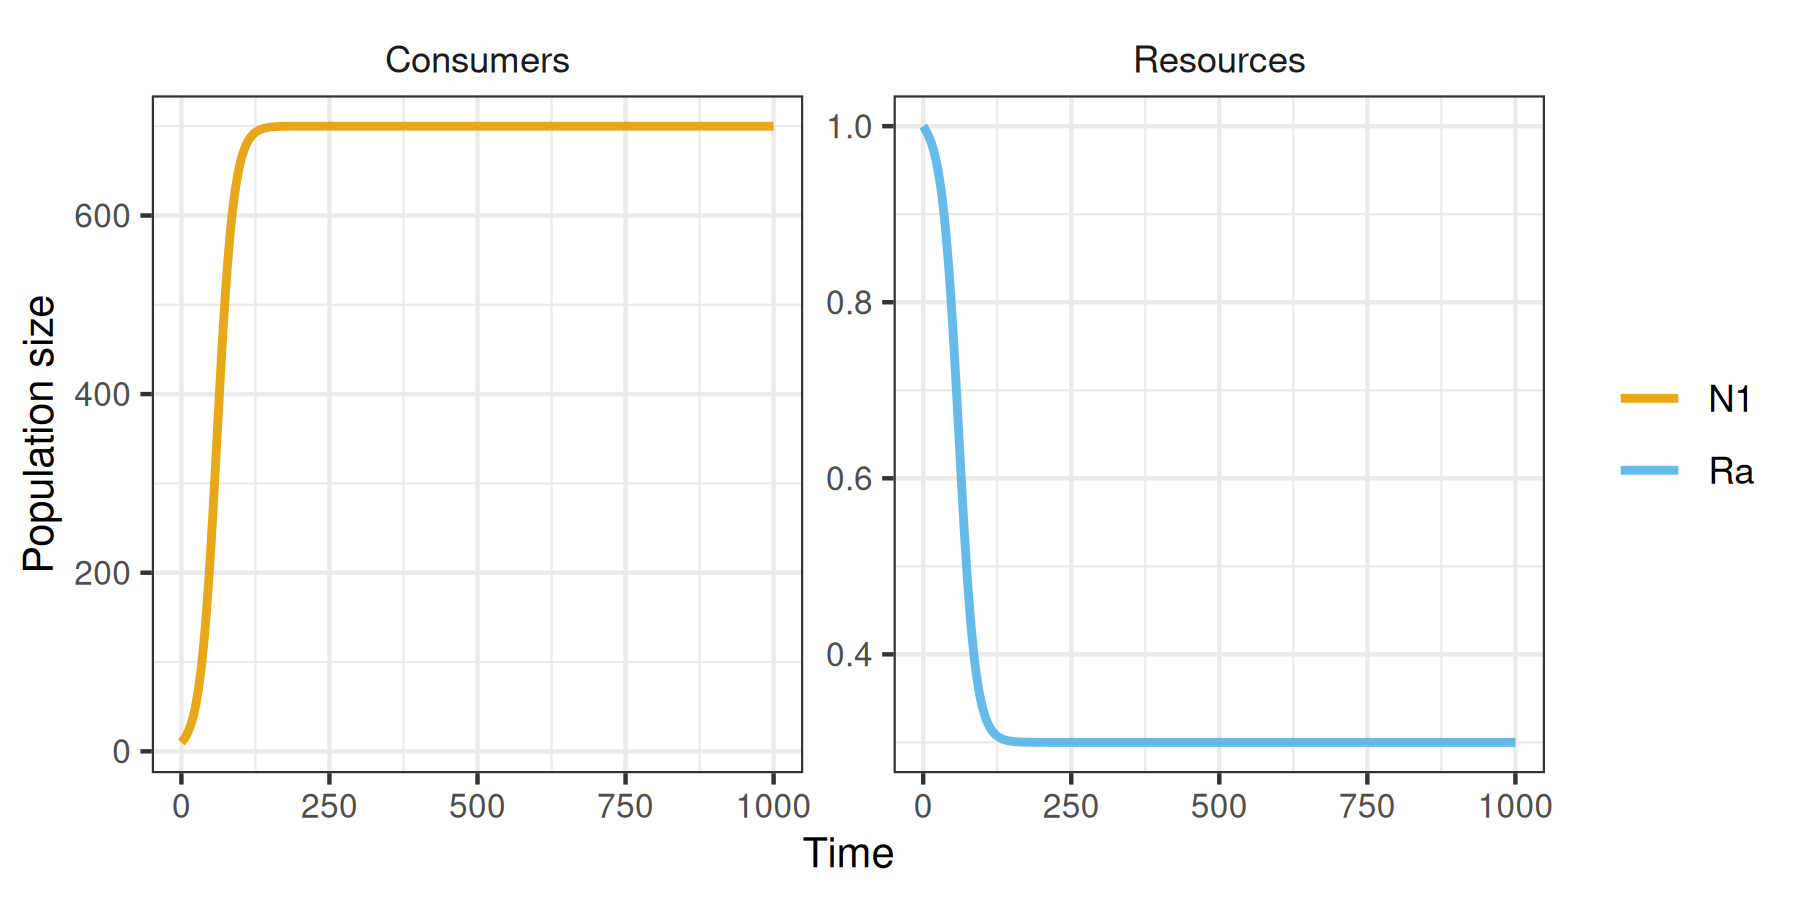
Note, the core rescomp functions are compatible with pipes. For
example spec_rescomp() |> sim_rescomp() |> plot_rescomp() will output
the plot above.
The main utility of rescomp comes with specifying more elaborate models and simulation dynamics. Features/options include (but are not limited to):
- Unlimited number of consumers/resources
- Consumer functional response (type I, II or III)
- Resource dynamic (chemostat, logistic and/or pulsed)
- Resource type (substitutable or essential)
- Continuous or intermittent mortality (e.g. serial transfer)
- Time dependent growth and consumption parameters
- Delayed consumer introduction times
See ?spec_rescomp for all argument options.
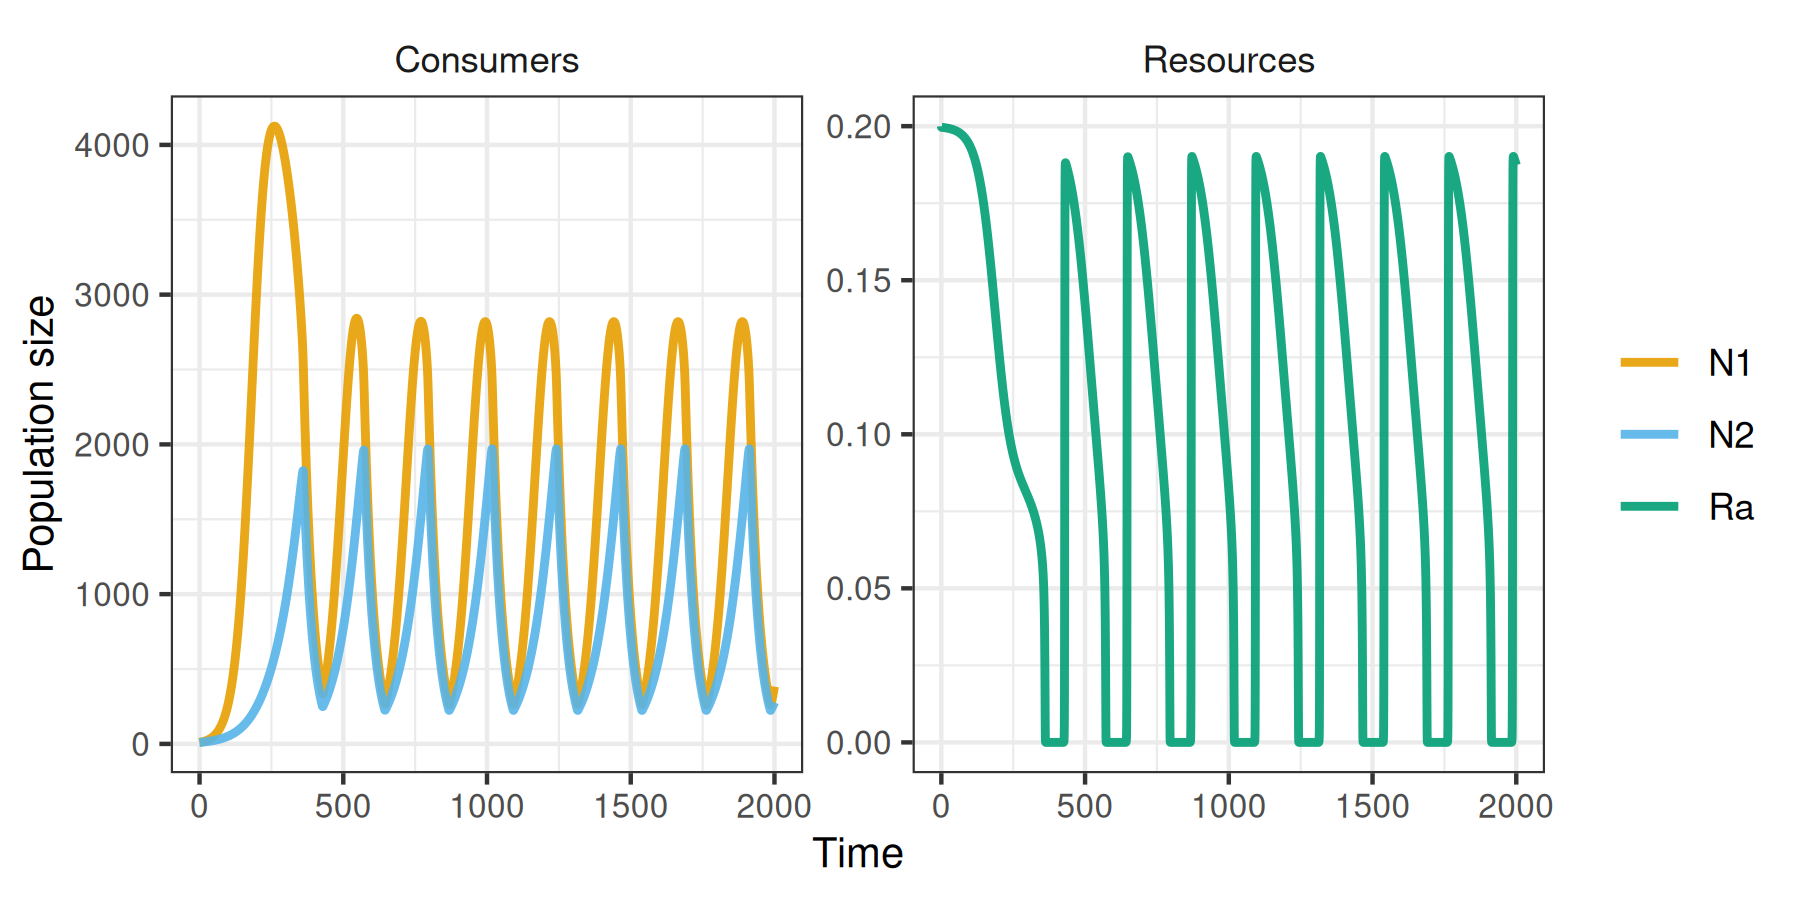
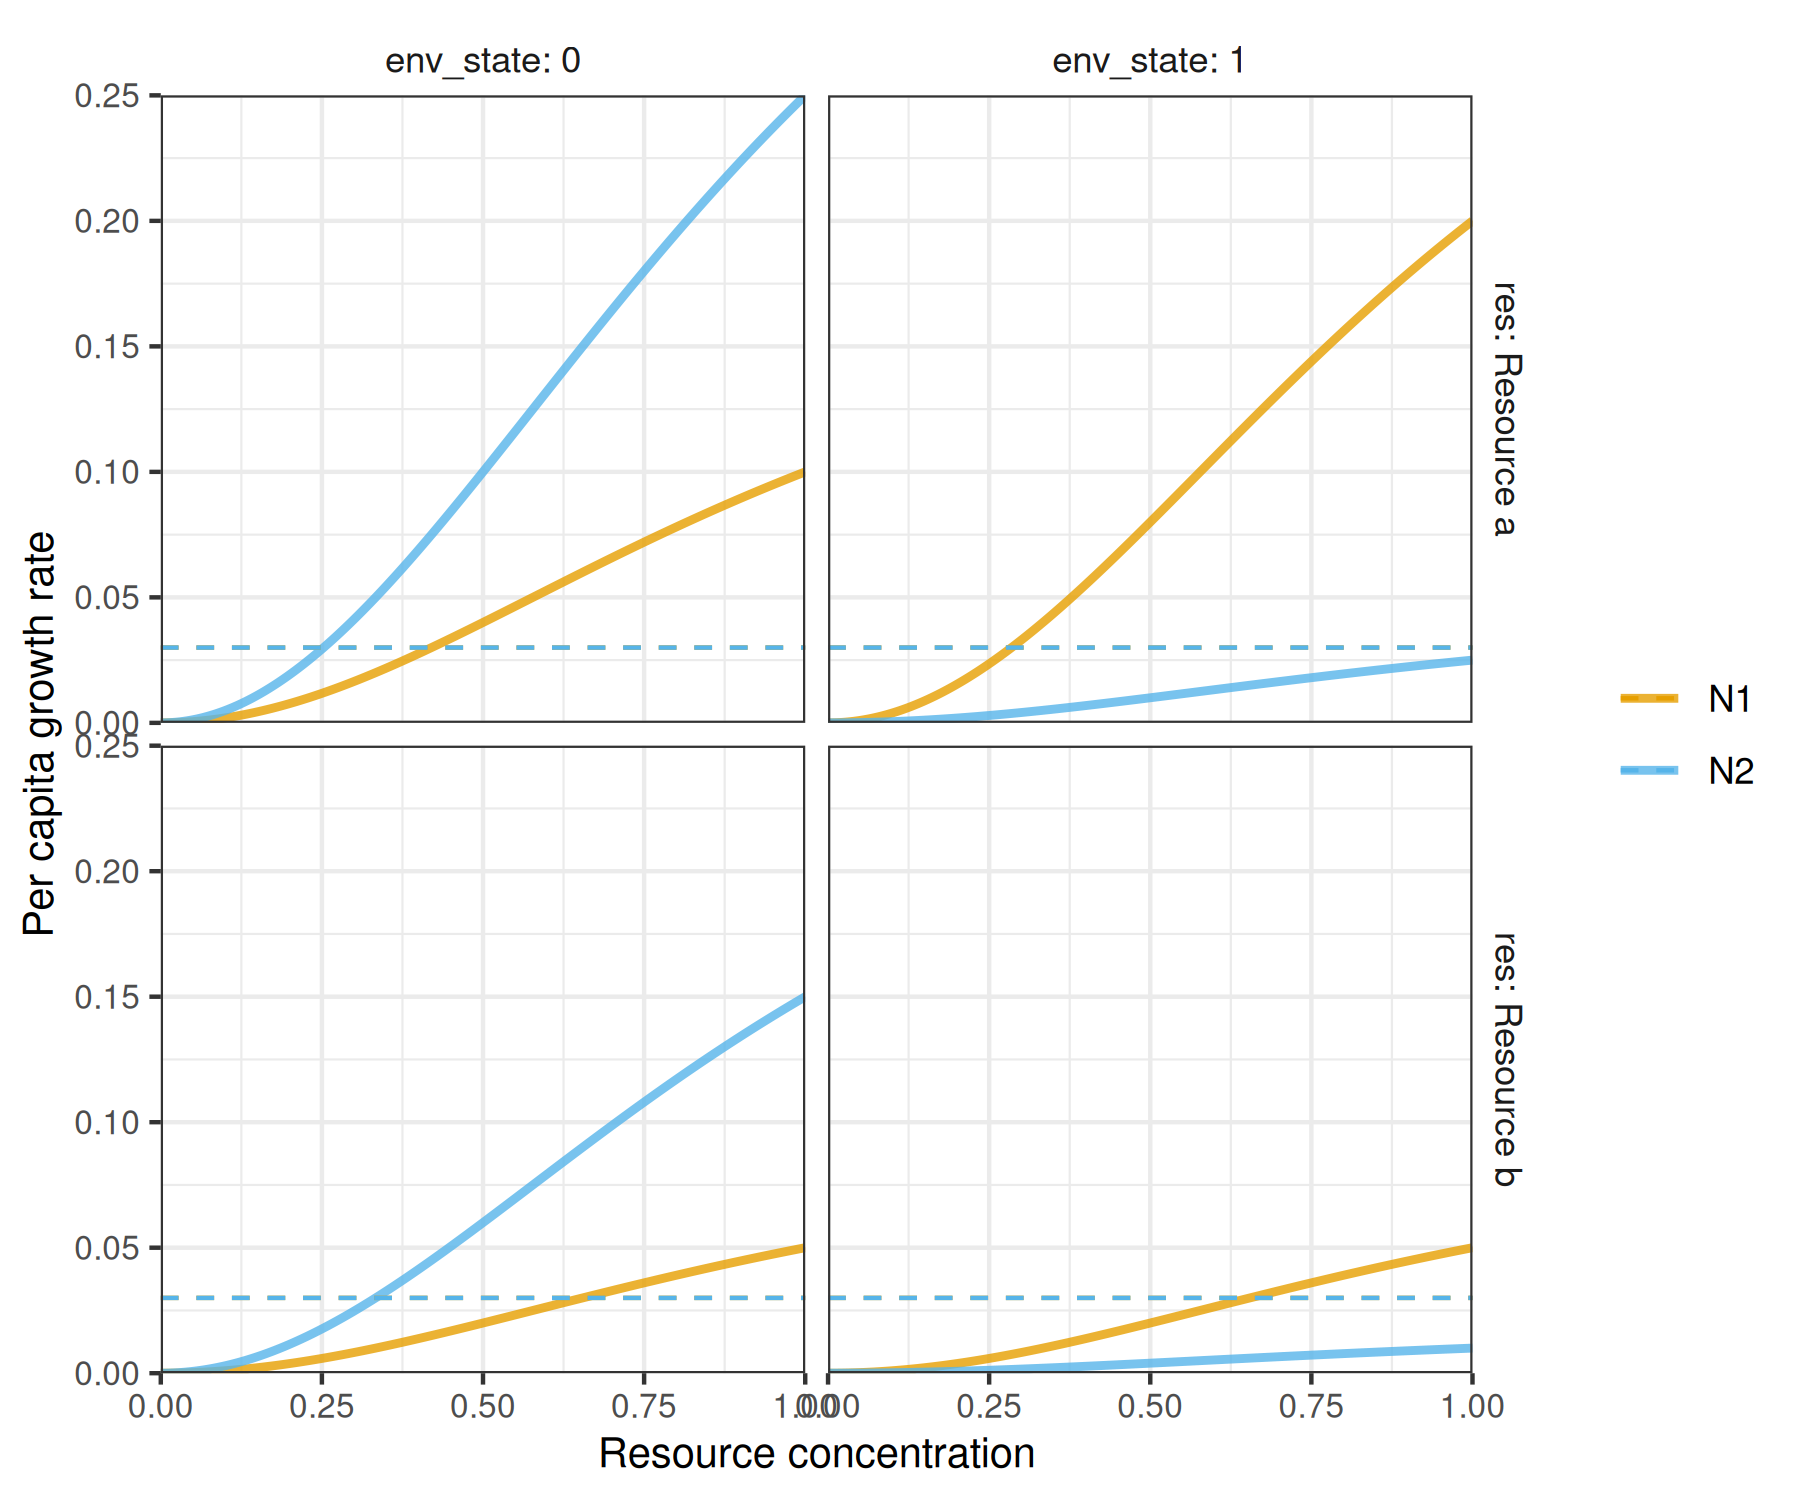
The following two examples demonstrate how to build and simulate a model for: i) two consumers with type II functional responses on a single logistically growing resources; and ii) two consumers with type III functional responses with pulsed resources and time dependent growth parameters. A wide range of other examples can be found in the package vignettes.
Example 1
pars <- spec_rescomp(
  spnum = 2,
  resnum = 1,
  funcresp = funcresp_monod(
    mumax = crmatrix(0.7, 0.05),
    ks = crmatrix(2, 0.015)
  ),
  rinit = 0.2,
  ressupply = ressupply_logistic(
    r = 3,
    k = 0.2
  ),
  totaltime = 2000
)
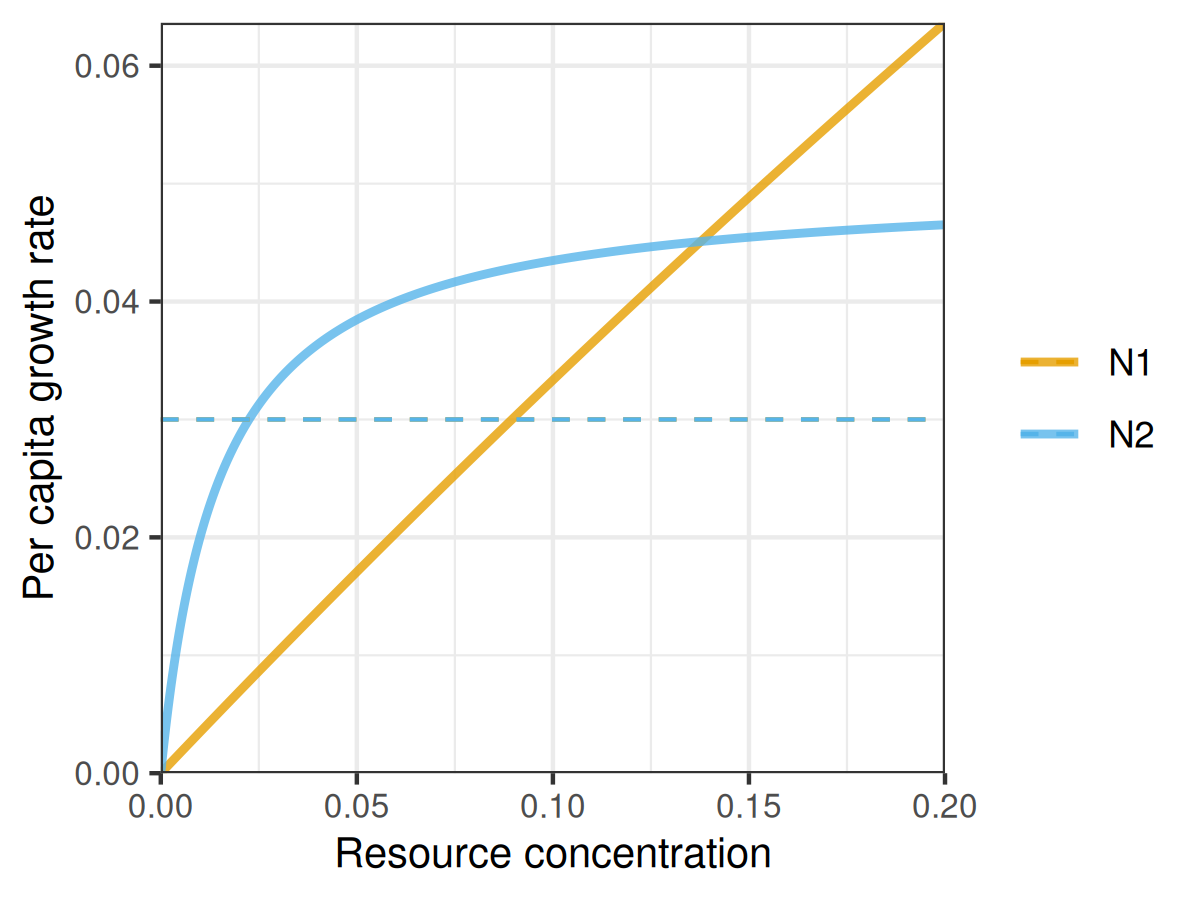
plot_funcresp(pars, maxx = 0.2)
m2 <- sim_rescomp(pars)
plot_rescomp(m2)
Example 2
pars <- spec_rescomp(
  spnum = 2,
  resnum = 2,
  funcresp = funcresp_hill(
    mumax = rescomp_coefs_lerp(
      crmatrix(
        0.2, 0.1,
        0.5, 0.3
      ),
      crmatrix(
        0.4, 0.1,
        0.05, 0.02
      ),
      "env_state"
    ),
    ks = crmatrix(1),
    n = crmatrix(2)
  ),
  params = list(
    env_state = rescomp_param_square(period = 80)
  ),
  ressupply = ressupply_constant(0),
  events = list(
    event_schedule_periodic(
      event_res_add(1),
      period = 40
    )
  ),
  totaltime = 1000
)
plot_funcresp(pars, maxx = 1)
m3 <- sim_rescomp(pars)
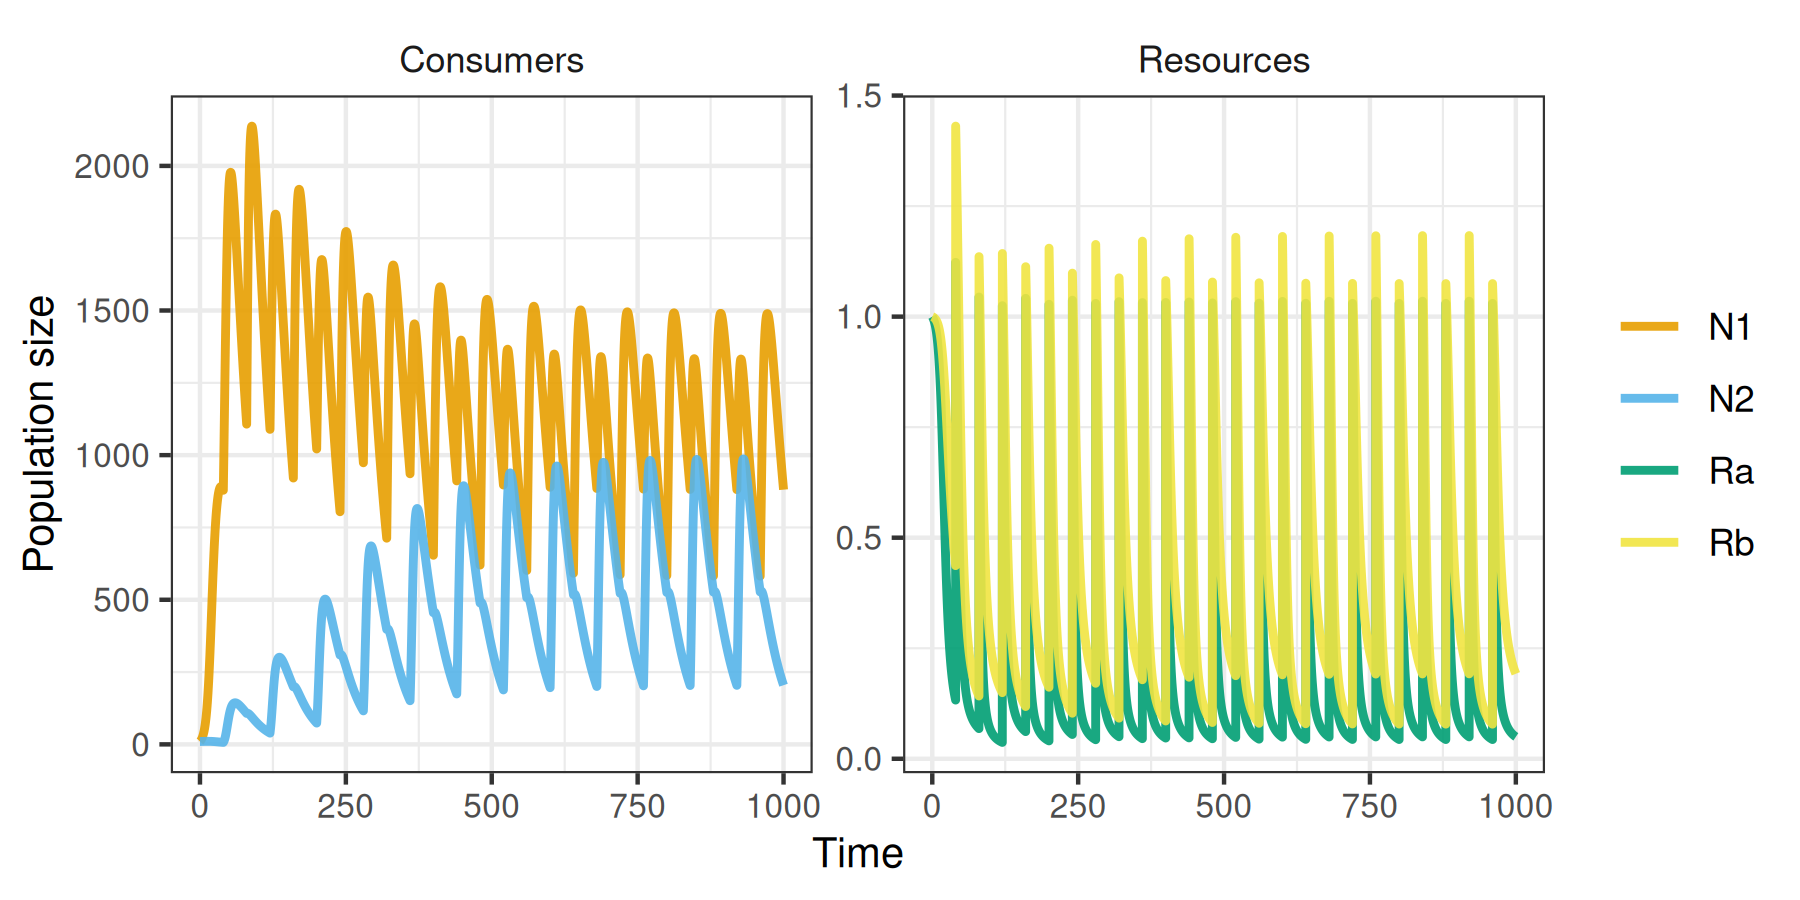
plot_rescomp(m3)