tbl.now
Tidy Data and Workflow Layer for Epidemic Nowcasting
Defines tidy data structures and package-agnostic workflows for epidemiological nowcasting. The 'tbl_now' class records event, report, and revision dates alongside strata, covariates, censoring, and reporting-delay metadata while remaining compatible with 'dplyr'. Tools support validation, manipulation, diagnostics, visualization, format conversion, retrospective evaluation, and multiple modelling engines. The 'tbl_nowcast' class standardizes probabilistic predictions for plotting, scoring, comparison, and ensembling.
Tibble now (tbl.now) 


tbl.now extends
tibble() for storing, validating, and
manipulating epidemiological nowcasting data. It standardizes event
dates, report dates, strata, temporal covariates, and related metadata
in a shape compatible with many frameworks, including
diseasenowcasting,
epinowcast,
NobBS,
surveillance,
EpiNow2, and more. Finally, it also
standardizes the prediction engines and their results for plotting,
scoring, comparing, and ensembling models.
A tbl_now keeps track of the attributes needed for a nowcasting
exercise, so dplyr transformations preserve the relevant nowcasting
variables:
|
Argument |
What it records |
|
|---|---|---|
|
|
The column storing event dates; i.e. when the epidemiological phenomenon of interest happened (symptom onset, hospitalisation, death, …). Required. |
|
|
The column storing report dates; i.e. when that event
became known to the surveillance system. Required,
unless it is reconstructed from |

|
|
An optional third date indicating when the report was resolved (see
|

|
|
What the revision date resolved to. Only |
|
|
The date the nowcast is anchored to — “today” from the model’s point of view. Optional; defaults to the latest date. |
|
|
Columns you want a separate nowcast for (e.g. gender, region). Optional. |
|
|
Columns that inform the nowcast but that you do not want it broken down by (e.g. temperature or precipitation). Optional. |

|
|
The column holding the counts when the data is given as aggregated (rather than line-list). Optional. |
|
|
Whether the data represents a |
|
|
The time grid each date lives on: |
|
|
Flags dates from either the report or the revision axis that are only an upper bound, i.e. the true report happened before the date given in the database. Optional. |
|
|
Columns holding temporal effects (day of week, holidays, …) that some models can use. Optional. |
You can specify an object as a tbl.now with the tbl_now command:
library(dplyr)
library(tbl.now)
data(denguedat)

#Here we use just a few dates for the example
denguedat <- denguedat |>
  filter(onset_week >= as.Date("2005/01/01"),
         report_week <= as.Date("2005/10/01"))

#And we specify as a tbl_now:
denguedat <- denguedat |>
  tbl_now(
    report_date = report_week,
    event_date = onset_week,
    strata = gender
  )

#Which is just a tibble with extra attributes
denguedat
#> # A tibble:  1,652 × 6
#> # Data type: "linelist"
#> # Frequency: Event: `weeks` | Report: `weeks`
#>   onset_week   report_week   gender   .event_num .report_num .delay
#>   <date>       <date>        <chr>         <dbl>       <dbl>  <dbl>
#>   [event_date] [report_date] [strata]      [...]       [...]  [...]
#> 1 2005-01-03   2005-01-17    Male              0           2      2
#> 2 2005-01-03   2005-01-10    Female            0           1      1
#> 3 2005-01-03   2005-01-10    Female            0           1      1
#> 4 2005-01-03   2005-01-10    Male              0           1      1
#> 5 2005-01-03   2005-01-10    Male              0           1      1
#> # ────────────────────────────────────────────────────────────────────────────────────────────────────────────────────────────────────────────────────────────────
#> # Now: 2005-09-26 | Event date: "onset_week" | Report date: "report_week"
#> # Strata: "gender"
#> # ────────────────────────────────────────────────────────────────────────────────────────────────────────────────────────────────────────────────────────────────
#> # ℹ 1,647 more rows
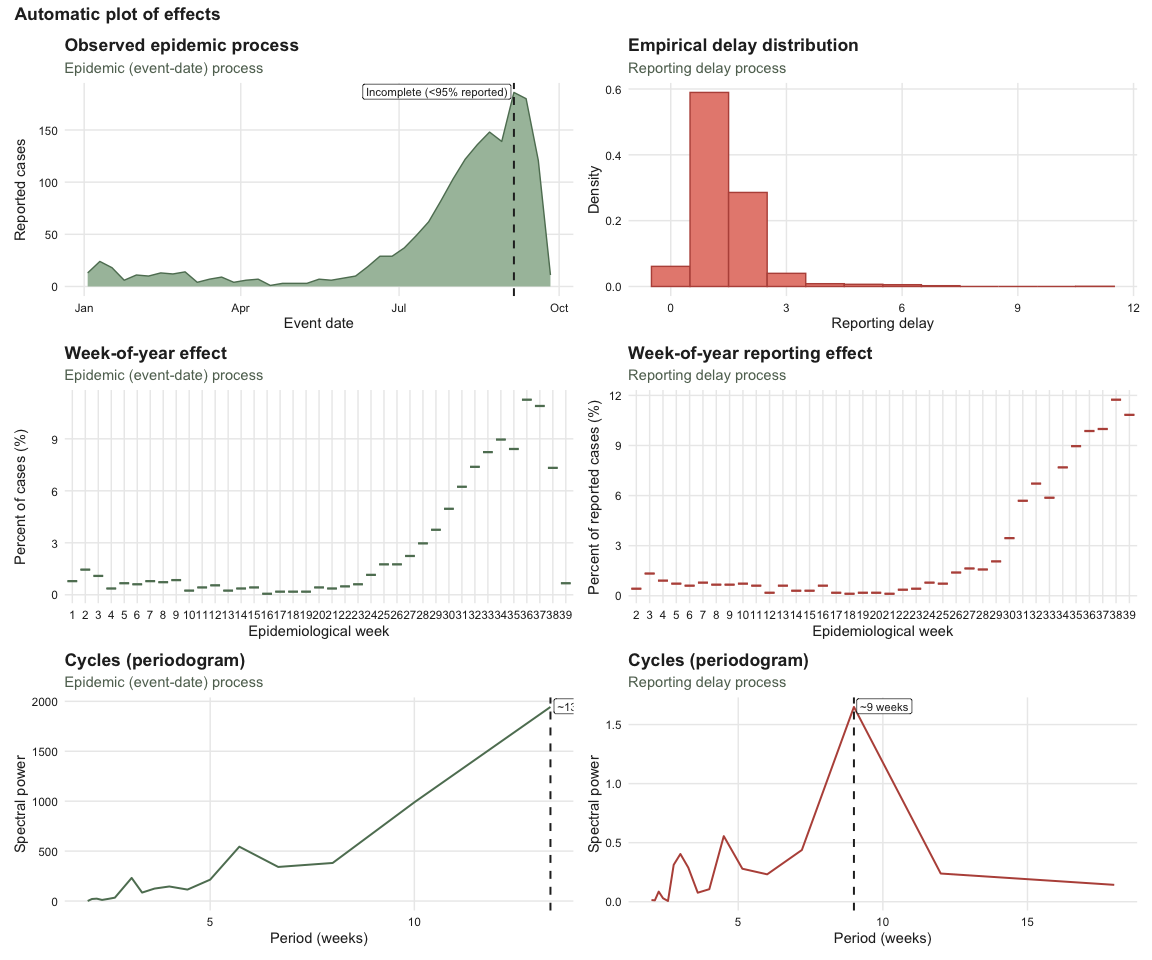
Once transformed, it can help you diagnose data problems (see this article) or modeling requirements with your database:
autoplot(denguedat)
And it can be used to run any of multiple nowcast libraries through the
engine() and run_nowcast specifications (see this
article).
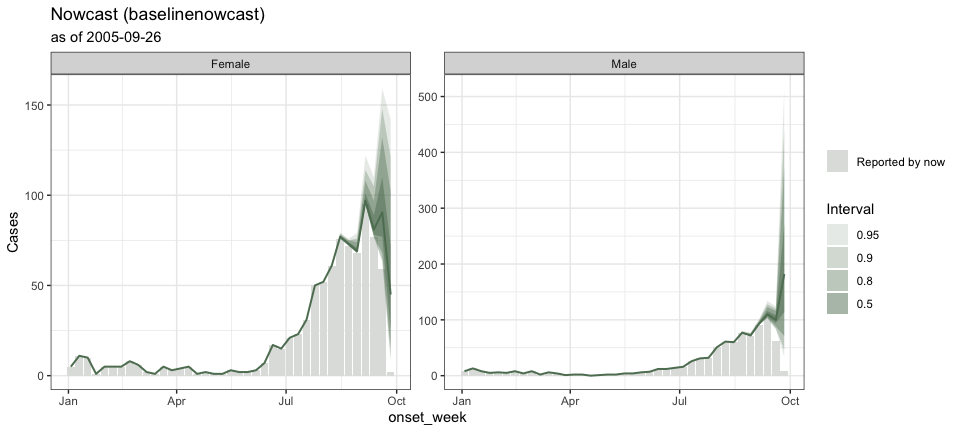
For example, baselinenowcast:
dengue_nowcast_1 <- denguedat |>
  run_nowcast(engine = engine_baselinenowcast())
autoplot(dengue_nowcast_1)
dengue_nowcast_2 <- denguedat |>
  run_nowcast(engine = engine_diseasenowcasting())
autoplot(dengue_nowcast_2)
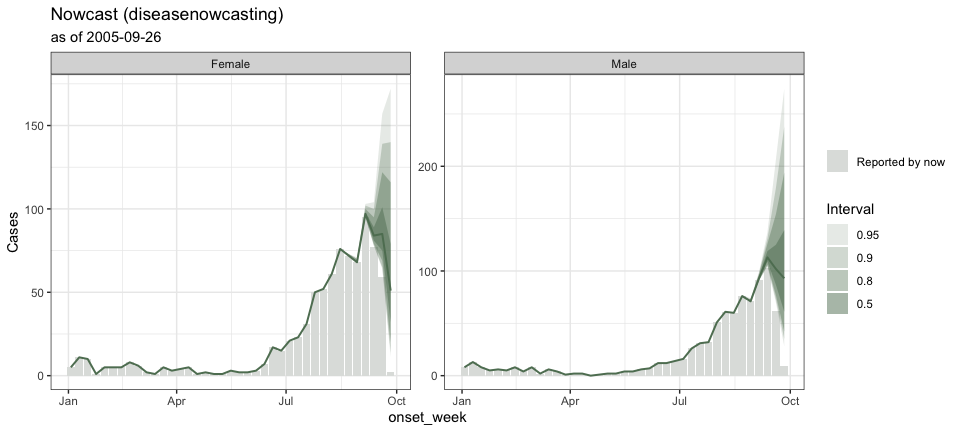
It can also generate ensemble nowcasts combining multiple engines or multiple realizations from the same engine as you can see in this article:
dengue_ensemble <- nowcast_ensemble(
  baselinenowcast   = dengue_nowcast_1,
  diseasenowcasting = dengue_nowcast_2
)
autoplot(dengue_ensemble)
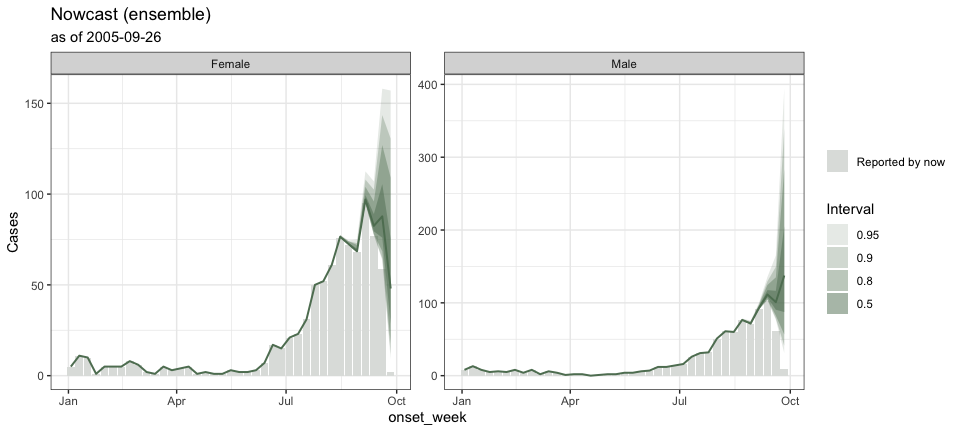
If this seems as exciting to you as it is to us, install the development version from R universe:
install.packages("tbl.now", repos = c("https://rodrigozepeda.r-universe.dev", getOption("repos")))
and checkout our articles starting with the Get started guide:
If you have any questions or comments regarding the contents of this article please open an issue on Github.
Learning more
- A tutorial on real life surveillance data. Takes you from cleaning to diagnosing errors in the data to nowcasting: https://rodrigozepeda.github.io/tbl.now/articles/example.html
- The second part of the tutorial with a revision process: the optional third date, where a reported case is later confirmed, retracted or left pending: https://rodrigozepeda.github.io/tbl.now/articles/example_revisions.html
- The Get started vignette: the whole workflow, from a raw line list to a scored nowcast, in five minutes: https://rodrigozepeda.github.io/tbl.now/articles/tbl.now.html.
- More on the
tbl_nowobject: every attribute, the three data types, the revision process, temporal effects and thedplyrmethods: https://rodrigozepeda.github.io/tbl.now/articles/more-on-tbl-now.html - More thoughts on diagnosing your dataset with
tbl.nowhttps://rodrigozepeda.github.io/tbl.now/articles/diagnosing-a-tbl-now.html - Detecting reporting batches with
tbl.nowhttps://rodrigozepeda.github.io/tbl.now/articles/batches.html - How to use different nowcasting engines from
tbl.now: here you can learn how it connects to the other nowcasting packages. https://rodrigozepeda.github.io/tbl.now/articles/nowcasting-models.html - How to nowcast with multiple engines, backtest and ensemble nowcasts. https://rodrigozepeda.github.io/tbl.now/articles/ensemble-nowcasting.html
- Adding your own custom nowcasting model https://rodrigozepeda.github.io/tbl.now/articles/custom-nowcast-models.html
- Package reference: https://rodrigozepeda.github.io/tbl.now/reference/