censusindia
Census of India Data, 1901-2011, with Boundaries and Projections
Tables from every decennial Census of India from 1901 to 2011:
population time series, Primary Census Abstracts at state, district and
sub-district level, mother tongue tables, and Scheduled Caste and
Scheduled Tribe populations, together with Ministry of Health and Family
Welfare population projections to 2036. Historical series are drawn
from Jolad and Singh (2026)
censusindia 
censusindia is an R package to query Census of India data, 1901 to 2011, at state, district, and subdistrict level. It also provides MoHFW population projections through 2036. All data including population counts, primary census abstracts, mother tongue tables, and SC/ST tables can be 'attached' to district-boundary GeoJSONs for quick visualisation.
Installation
install.packages("censusindia")

# development version
install.packages("pak")
pak::pak("saketlab/censusindia")
Boundary files and the largest 2011 tables (village-level abstracts, mother
tongue, district age projections) are downloaded on first use, about 90 MB if
you fetch them all, and cached in census_cache_dir().
Quickstart
library(censusindia)

get_census(2011, "state")
get_census(1971, "district", state = "Maharashtra")
get_census(1971, "district", state = "MH", geometry = TRUE)

list_census_variables()
search_census_variables("literacy")
list_census_geographies()

# MOHFW population projections (2011-2036)
get_population(2031, "state")
get_population(2031, "district")

# mother tongue speakers by district (2011)
census_languages() |> dplyr::filter(district_name == "Pune")
Examples
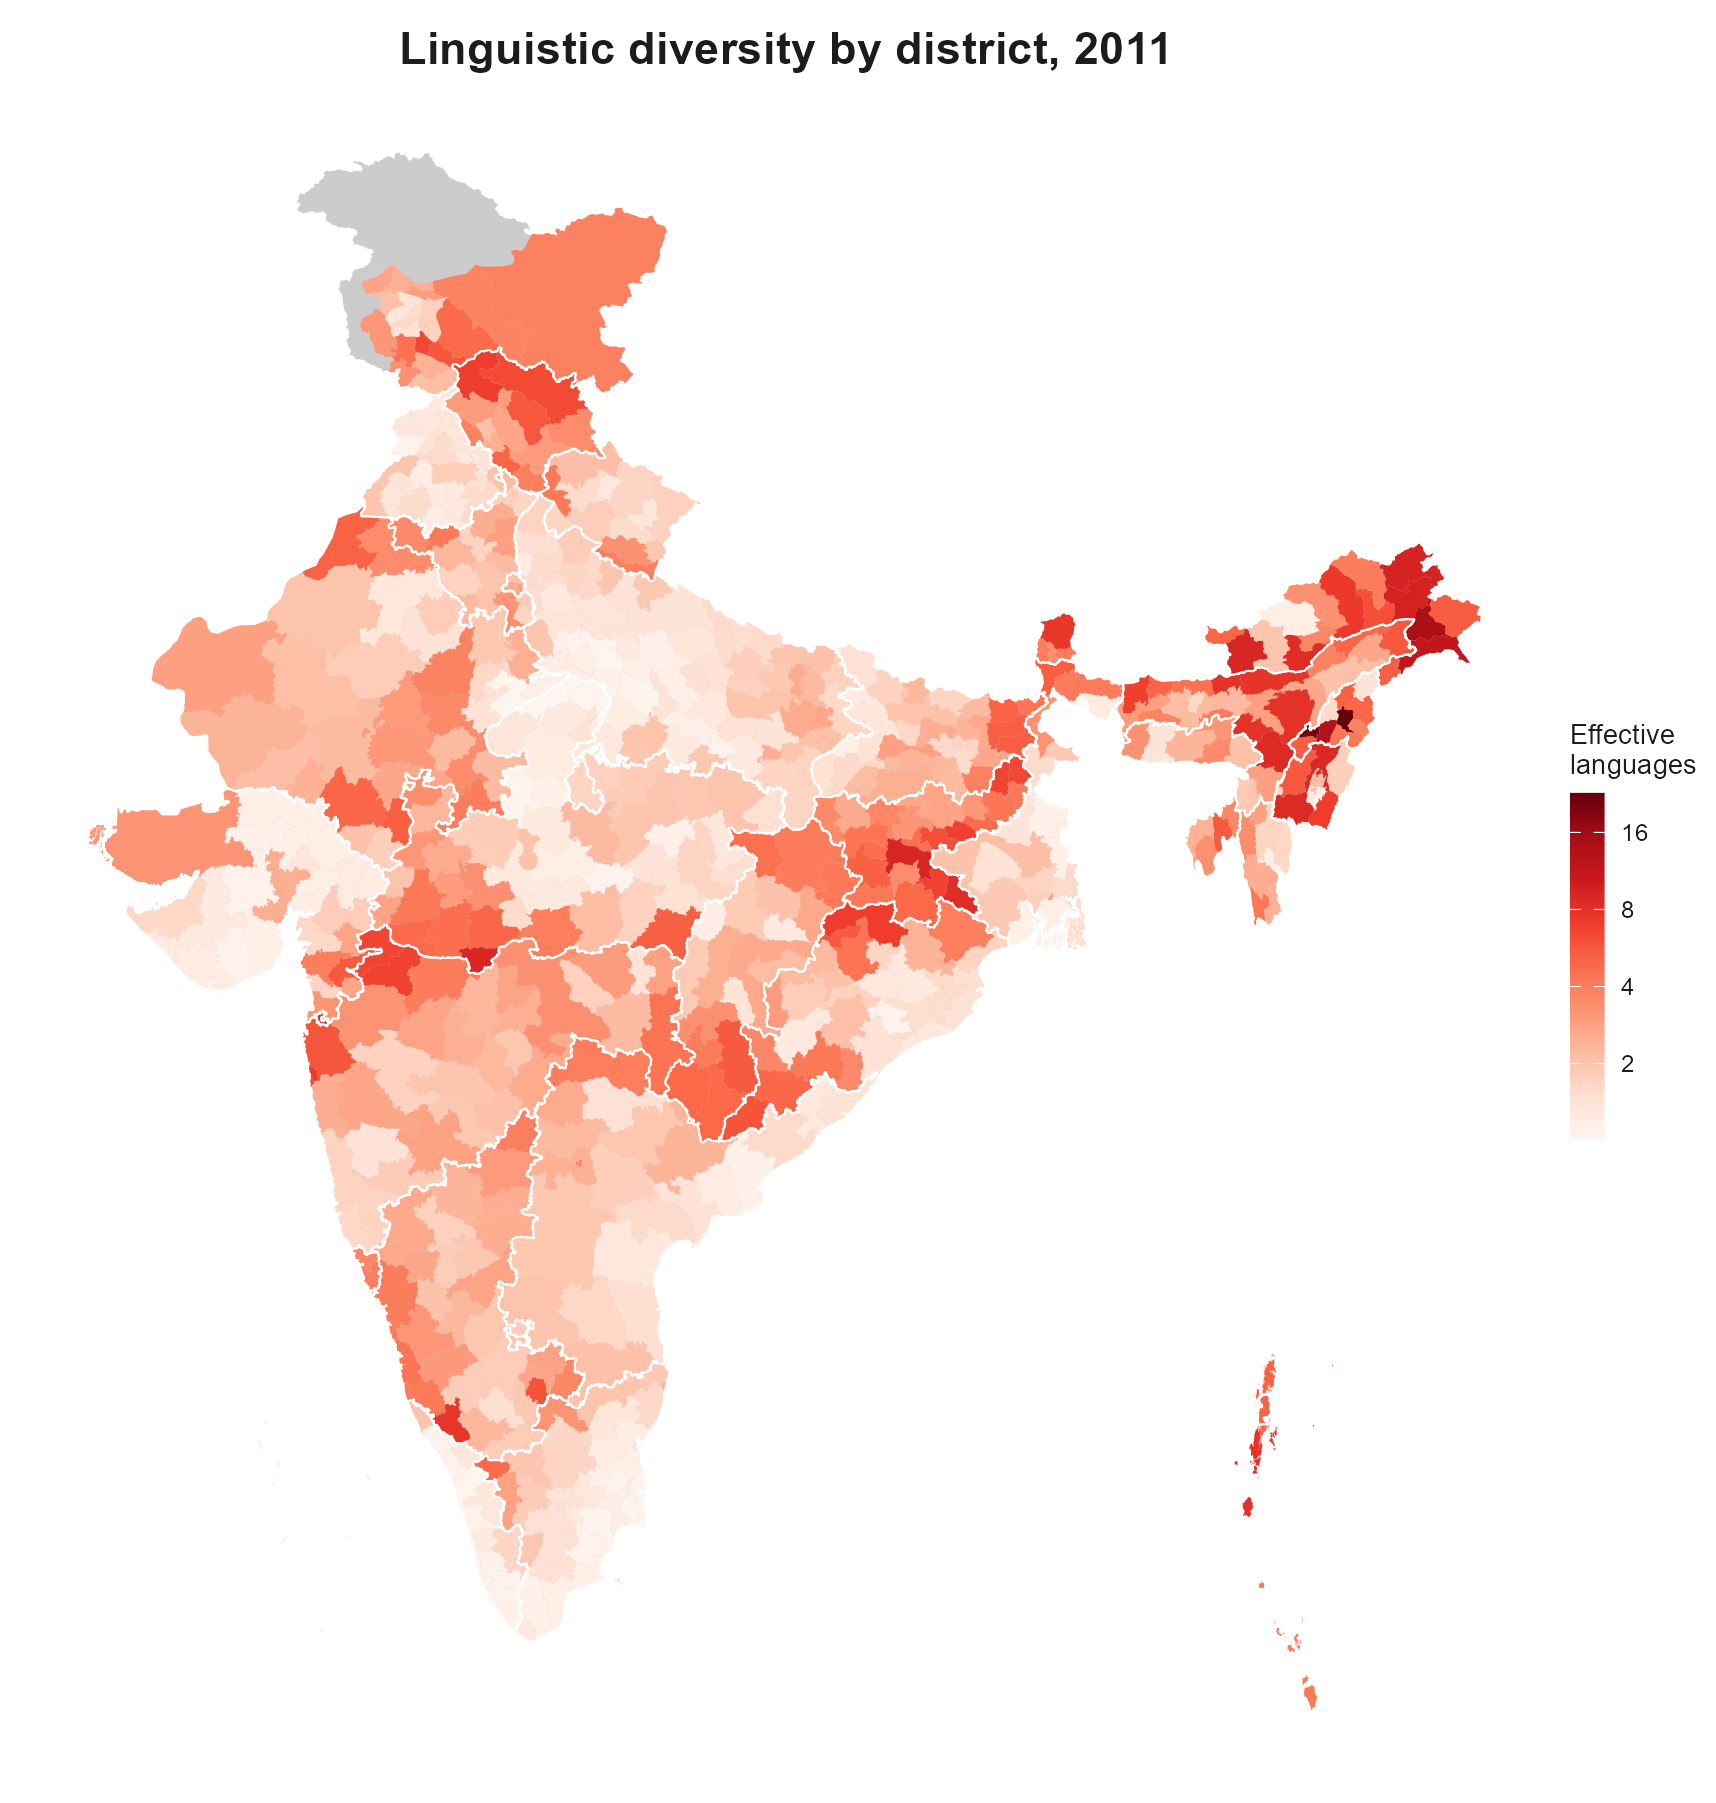
Linguistic diversity by district:
library(censusindia)
library(dplyr)

ling <- census_2011_linguistic_diversity |>
  rename(district = district_name) |>
  attach_geometry(2011, geography = "district")

plot_map(ling, "effective_languages",
  title = "Linguistic diversity by district, 2011",
  legend_title = "Effective\nlanguages",
  palette = "reds", show_state_boundaries = TRUE, trans = "log2"
)
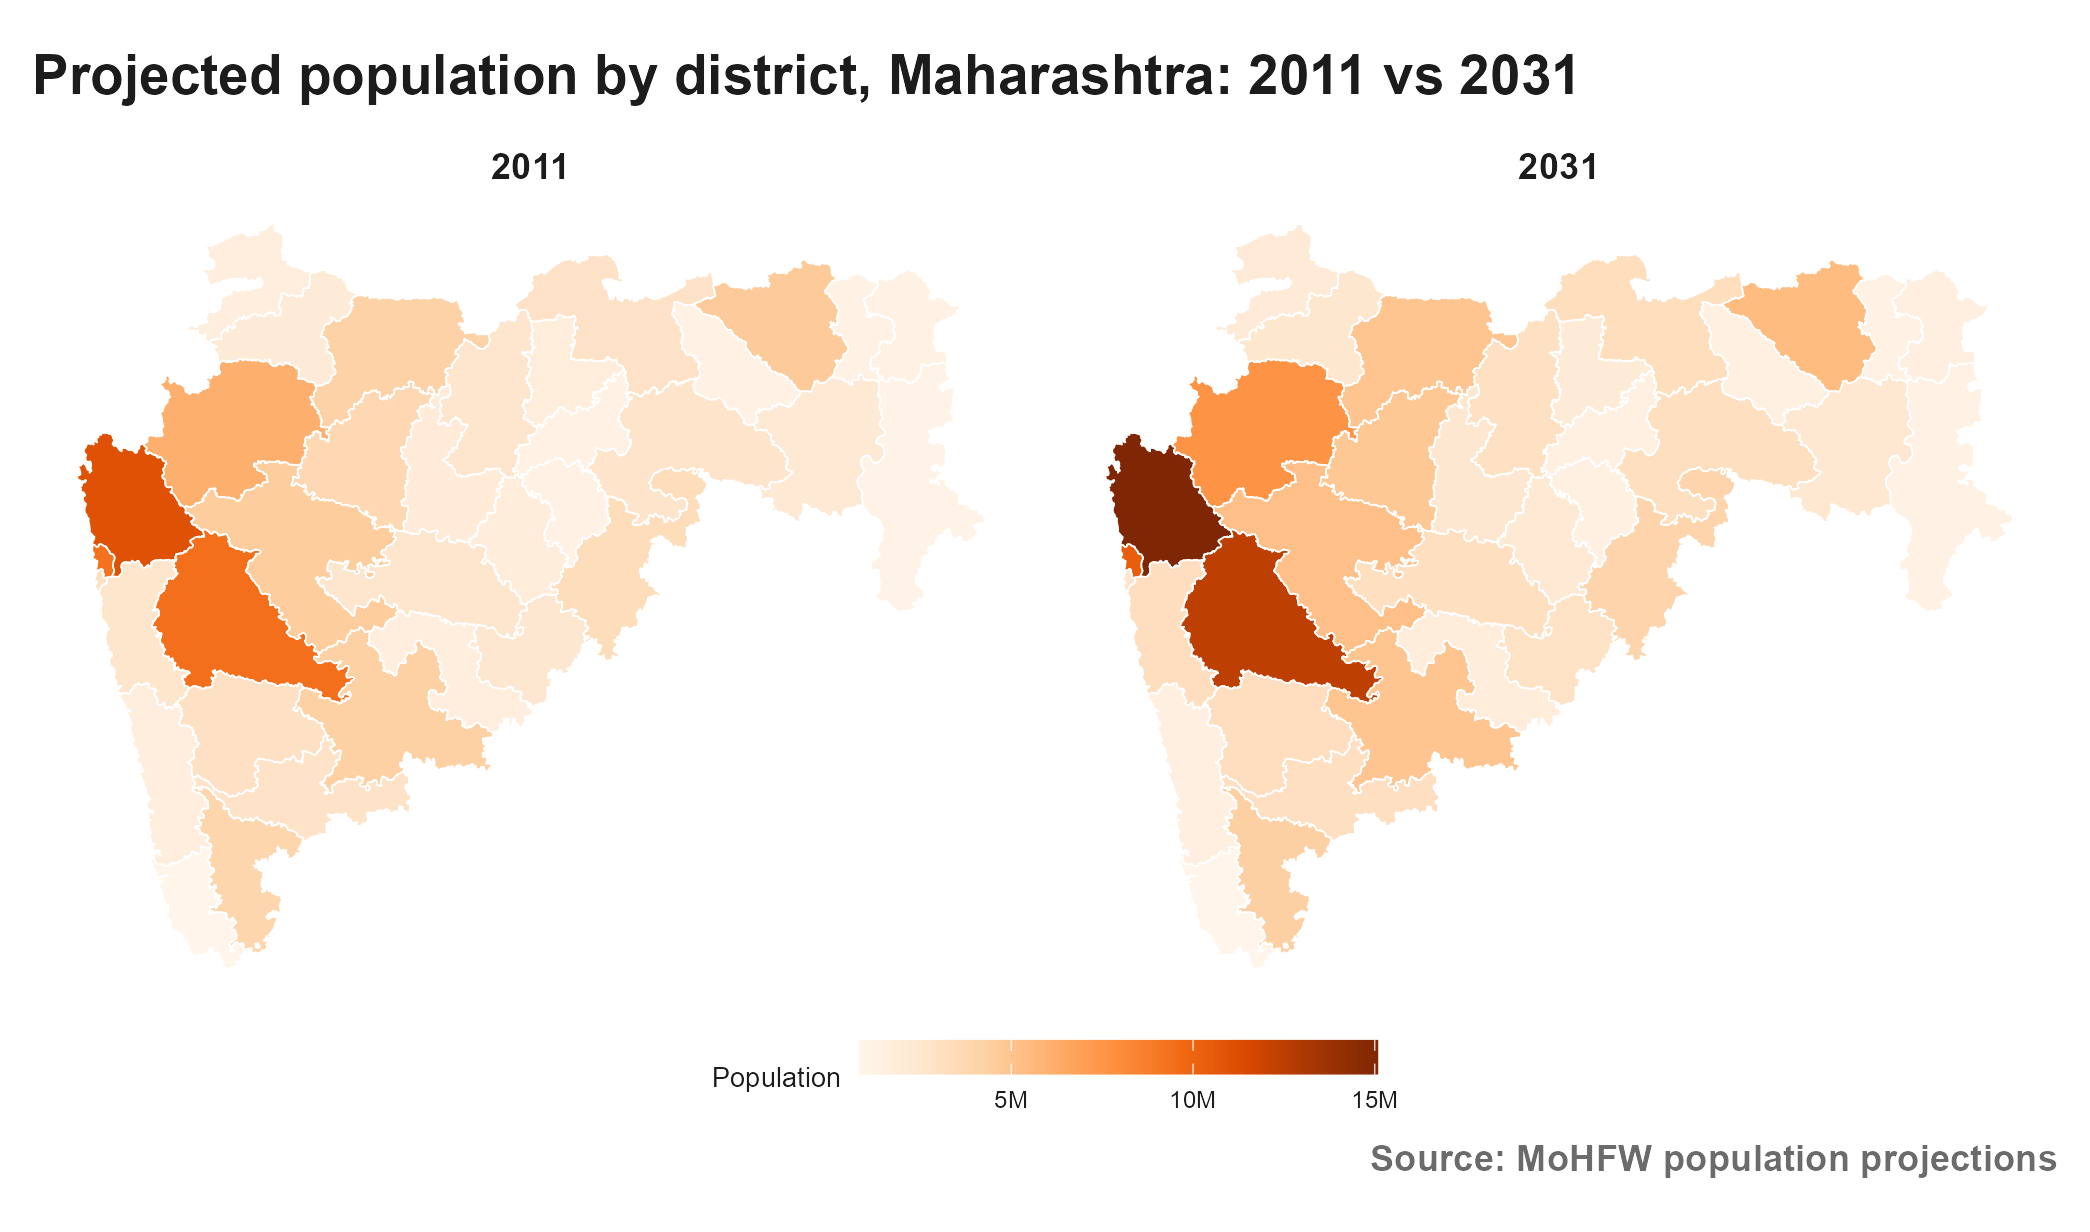
Projected district-level population, Maharashtra 2011 vs 2031:
mh_2011 <- get_population(2011, "district", state = "Maharashtra") |>
  attach_geometry(2011, geography = "district")
mh_2031 <- get_population(2031, "district", state = "Maharashtra") |>
  attach_geometry(2011, geography = "district")

compare_maps(
  list("2011" = mh_2011, "2031" = mh_2031),
  fill_var = "population",
  title = "Projected population by district, Maharashtra: 2011 vs 2031",
  palette = "oranges",
  base_layer = FALSE
)
Languages spoken in a district, ranked by speakers:
library(dplyr)

census_languages() |>
  filter(district_name == "Pune") |>
  arrange(desc(total_speakers)) |>
  select(language_name, total_speakers)
Vignettes
- Getting started
- Primary Census Abstract, 2001 and 2011
- Population maps
- Population dynamics
- Population projections
- Sex ratio evolution
- SC/ST population distribution
- Social composition
- Linguistic diversity
- Tribal isolation and vulnerability
- District population overview
Data sources
- Population time series (1901-2011), 1961 literacy, 1971/1981 PCA, 2011 subdistrict and PCA tables: Jolad, S. & Singh, M. (2026). Indian Census Data Collection, 1901-2026: Digitised Subnational Population and Administrative Datasets. Harvard Dataverse.
- 2001 and 2011 Primary Census Abstract, C-16 mother tongue tables, A-10/A-11 SC/ST tables: Census of India, Office of the Registrar General & Census Commissioner, India.
- Population projections, state level (2011-2036): Ministry of Health and Family Welfare, Government of India. Population Projections for India and States 2011-2036 | PDF.
- Population projections, district level (2011-2031): International Institute for Population Sciences. Projection of District Level Annual Population by Quinquennial Agegroup and Sex.
- District/state boundary GeoJSONs: via bharatviz.org, collated from Jolad & Singh (2026) and ramSeraph/indian_admin_boundaries.