explore
Simplifies Exploratory Data Analysis
Interactive data exploration with one line of code, automated reporting or use an easy to remember set of tidy functions for low code exploratory data analysis.
explore 

Simplifies Exploratory Data Analysis:
- Interactive data exploration:
explore() - Use AI to unveil hidden patterns in your data (xgboost, RF, logreg, DT):
explain_*() - Generate an automated report of your data (or patterns in your data):
report() - Manual exploration:
explore(),describe(),explain_*(),abtest(), ... - 18 ready to use datasets for teaching & testing:
use_data_*(),create_data_*()
# install from CRAN
install.packages("explore")
Examples
# interactive data exploration
library(explore)
beer <- use_data_beer()
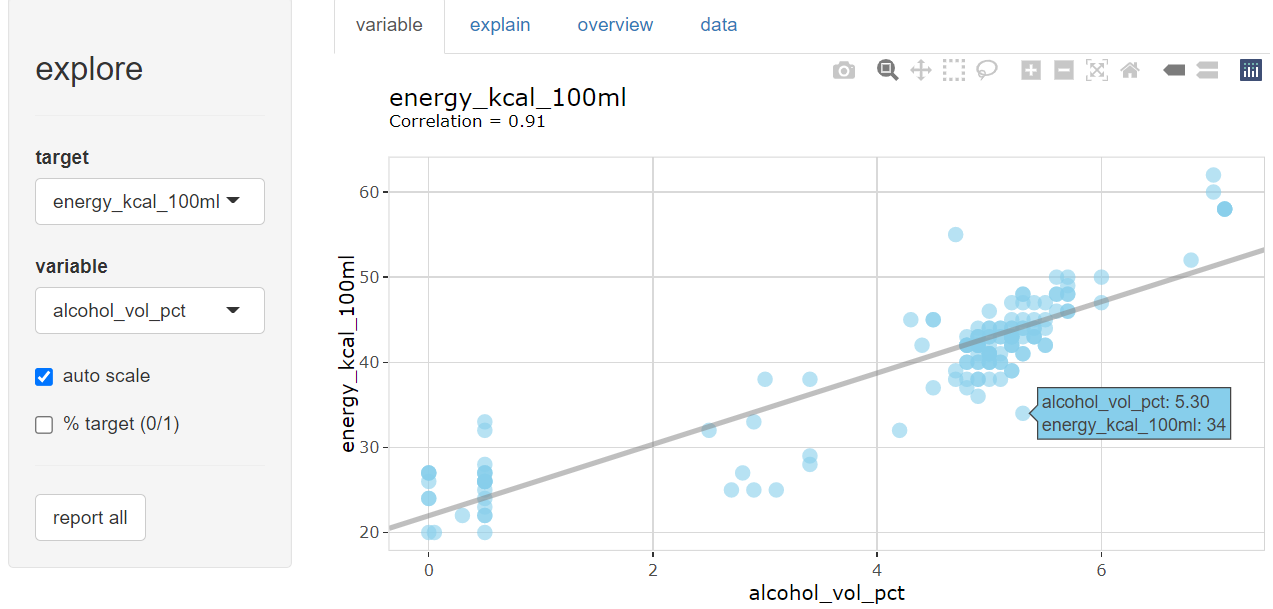
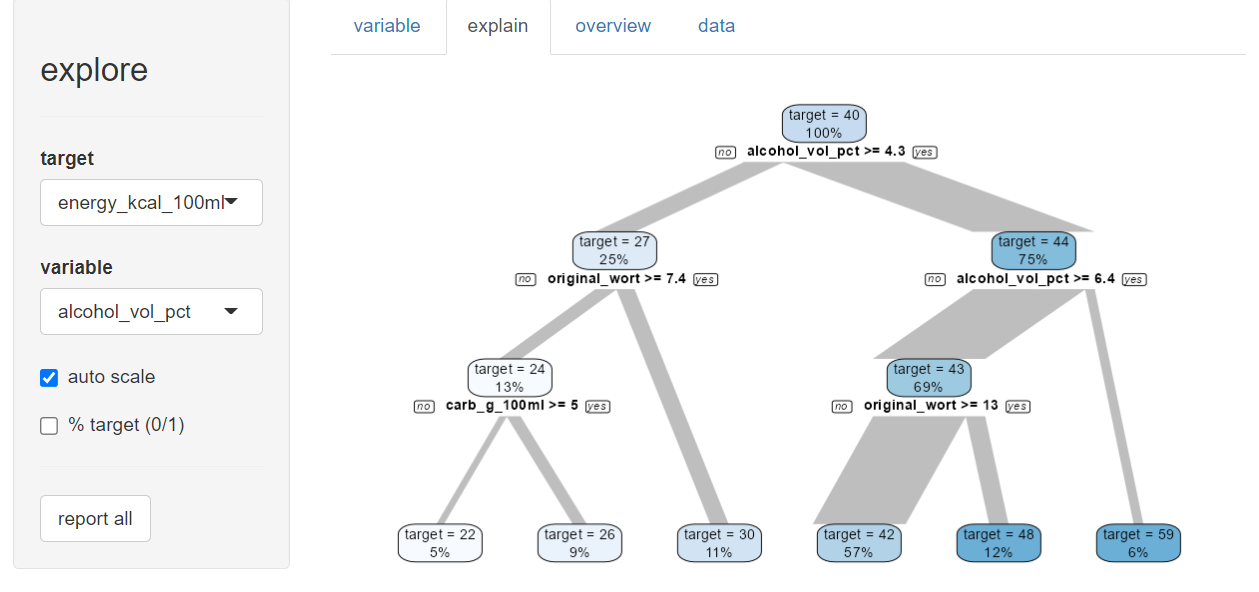
beer |> explore()
# describe data
beer |> describe()
# A tibble: 11 × 8
   variable          type     na na_pct unique    min    mean    max
   <chr>             <chr> <int>  <dbl>  <int>  <dbl>   <dbl>  <dbl>
 1 name              chr       0    0      161   NA     NA      NA
 2 brand             chr       0    0       29   NA     NA      NA
 3 country           chr       0    0        3   NA     NA      NA
 4 year              dbl       0    0        1 2023   2023    2023
 5 type              chr       0    0        3   NA     NA      NA
 6 color_dark        dbl       0    0        2    0      0.09    1
 7 alcohol_vol_pct   dbl       2    1.2     35    0      4.32    8.4
 8 original_wort     dbl       5    3.1     54    5.1   11.3    18.3
 9 energy_kcal_100ml dbl      11    6.8     34   20     39.9    62
10 carb_g_100ml      dbl      16    9.9     44    1.5    3.53    6.7
11 sugar_g_100ml     dbl      16    9.9     26    0      0.72    4.6
# explore data manually
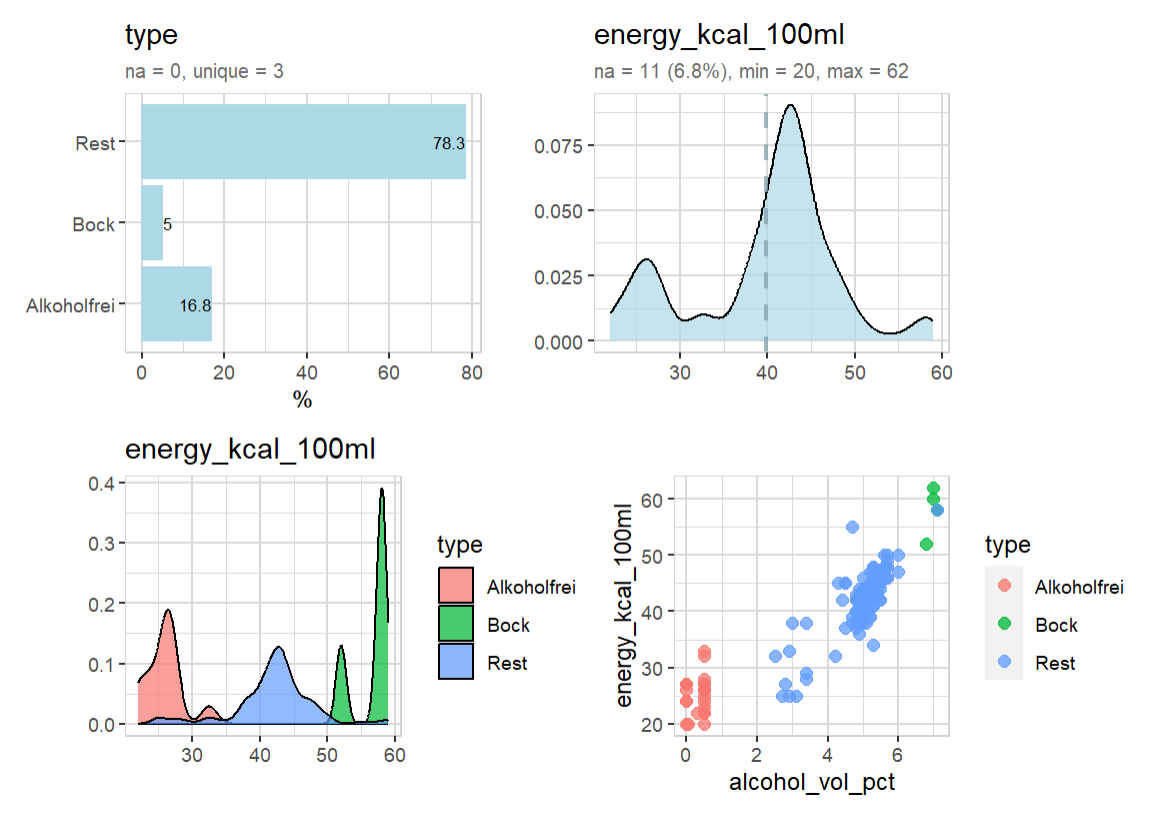
beer |> explore(type)
beer |> explore(energy_kcal_100ml)
beer |> explore(energy_kcal_100ml, target = type)
beer |> explore(alcohol_vol_pct, energy_kcal_100ml, target = type)
# explore manually with color and interactive
beer |>
  explore(sugar_g_100ml, color = "gold") |>
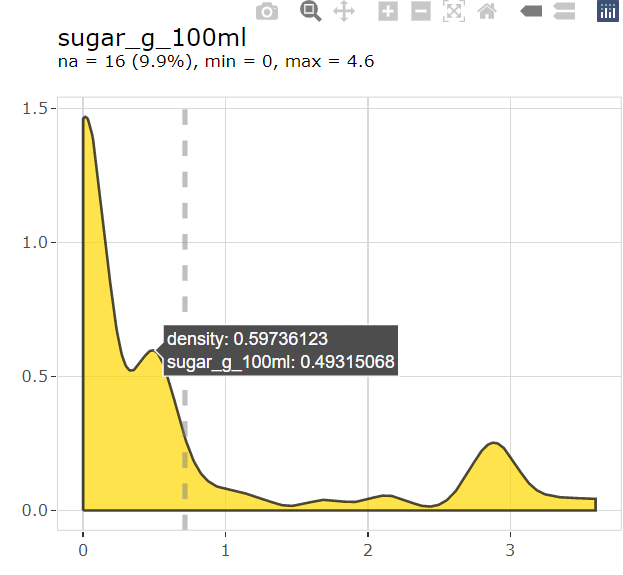
  interact()