ggExametrika


ggExametrika provides ggplot2-based visualization for the
exametrika package. It
supports a wide range of psychometric models:
| Model |
Description |
| IRT |
Item Response Theory (2PL, 3PL, 4PL) |
| GRM |
Graded Response Model |
| LCA |
Latent Class Analysis |
| LRA |
Latent Rank Analysis |
| LRAordinal |
Latent Rank Analysis for ordinal data |
| LRArated |
Latent Rank Analysis for rated data |
| Biclustering |
Simultaneous item/student clustering (binary) |
| nominalBiclustering |
Biclustering for nominal data |
| ordinalBiclustering |
Biclustering for ordinal data |
| IRM |
Infinite Relational Model |
| LDLRA |
Locally Dependent Latent Rank Analysis |
| LDB |
Locally Dependent Biclustering |
| BINET |
Bayesian Network and Test |
| BNM |
Bayesian Network Model |
Reference
Shojima, Kojiro (2022) Test Data Engineering: Latent Rank Analysis,
Biclustering, and Bayesian Network (Behaviormetrics: Quantitative
Approaches to Human Behavior, 13), Springer, ISBN 978-981-16-9985-6
Installation
# install.packages("devtools")
devtools::install_github("kosugitti/ggExametrika")
Examples
All plot functions take exametrika output directly and return ggplot
objects. Functions are named plotXXX_gg().
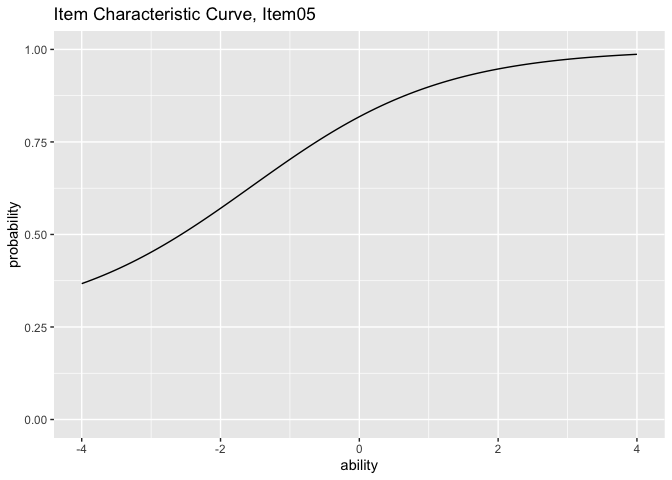
IRT: Item Characteristic Curve (plotICC_gg)
library(exametrika)
library(ggExametrika)

result_irt <- IRT(J15S500, model = 3)
plots <- plotICC_gg(result_irt)
plots[[5]]
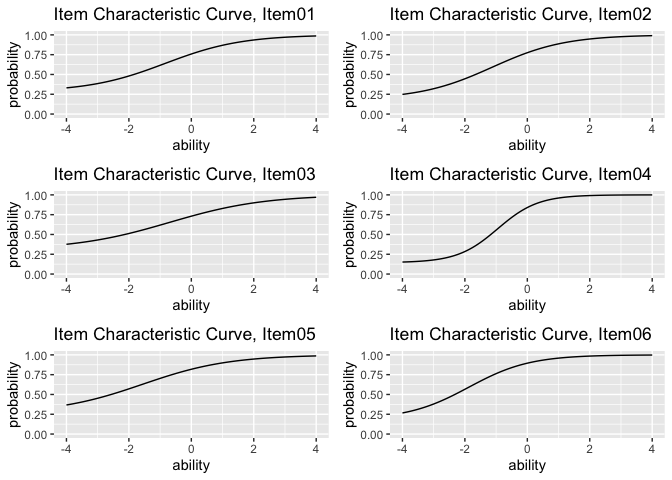
combinePlots_gg(plots)
IRT: Overlay Plots (plotICC_overlay_gg, plotIIC_overlay_gg)
# All ICCs on a single plot
plotICC_overlay_gg(result_irt, show_legend = TRUE)

# All IICs on a single plot (also works with GRM)
plotIIC_overlay_gg(result_irt, items = c(1, 3, 5), show_legend = TRUE)
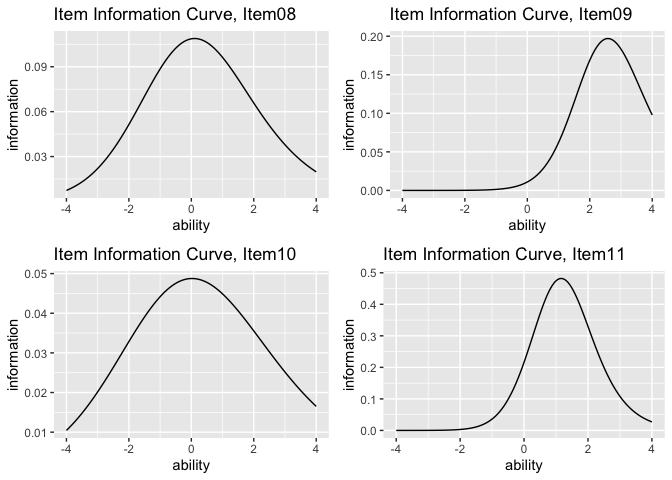
IRT: Item Information Curve (plotIIC_gg)
plots <- plotIIC_gg(result_irt)
combinePlots_gg(plots, selectPlots = 8:11)
IRT: Test Information Curve / Test Response Function (plotTIC_gg, plotTRF_gg)
plotTIC_gg(result_irt)
plotTRF_gg(result_irt)
GRM: Item Category Response Function (plotICRF_gg)
result_grm <- GRM(J5S1000)
plots <- plotICRF_gg(result_grm)
plots[[1]]
combinePlots_gg(plots, selectPlots = 1:5)

# GRM also supports IIC and TIC
plotIIC_gg(result_grm)
plotTIC_gg(result_grm)
LCA: Latent Class Analysis
result_lca <- LCA(J15S500, ncls = 3)

plotIRP_gg(result_lca)         # Item Reference Profile
plotFRP_gg(result_lca)         # Field Reference Profile
plotTRP_gg(result_lca)         # Test Reference Profile
plotLCD_gg(result_lca)         # Latent Class Distribution
plotCMP_gg(result_lca)         # Class Membership Profile
LRA: Latent Rank Analysis
result_lra <- LRA(J15S500, nrank = 4)

plotIRP_gg(result_lra)         # Item Reference Profile
plotFRP_gg(result_lra)         # Field Reference Profile
plotTRP_gg(result_lra)         # Test Reference Profile
plotLRD_gg(result_lra)         # Latent Rank Distribution
plotRMP_gg(result_lra)         # Rank Membership Profile
LRAordinal / LRArated
result_lra_ord <- LRA(J5S1000, nrank = 4)  # ordinal data

plotScoreFreq_gg(result_lra_ord)   # Score Frequency Distribution
plotScoreRank_gg(result_lra_ord)   # Score-Rank Heatmap
plotICRP_gg(result_lra_ord)        # Item Category Reference Profile
plotICBR_gg(result_lra_ord)        # Item Category Boundary Response (ordinal only)
plotRMP_gg(result_lra_ord)         # Rank Membership Profile
Biclustering (binary)
result_bic <- Biclustering(J35S515, nfld = 5, nrank = 6)

plotFRP_gg(result_bic)         # Field Reference Profile
plotTRP_gg(result_bic)         # Test Reference Profile
plotLCD_gg(result_bic)         # Latent Class Distribution
plotLRD_gg(result_bic)         # Latent Rank Distribution
plotCMP_gg(result_bic)         # Class Membership Profile
plotRMP_gg(result_bic)         # Rank Membership Profile
plotCRV_gg(result_bic)         # Class Reference Vector
plotRRV_gg(result_bic)         # Rank Reference Vector
plotArray_gg(result_bic)       # Array Plot (heatmap)
Biclustering (nominal / ordinal)
# Nominal Biclustering
result_nom <- Biclustering(data, ncls = 3, nfld = 4)

plotFRP_gg(result_nom, stat = "mean")   # stat: "mean", "median", or "mode"
plotFCRP_gg(result_nom, style = "line") # Field Category Response Profile (style: "line" or "bar")
plotScoreField_gg(result_nom)           # Expected Score Heatmap (field x class/rank)
plotCRV_gg(result_nom, stat = "mean")   # Class Reference Vector
plotRRV_gg(result_nom, stat = "mean")   # Rank Reference Vector
plotArray_gg(result_nom)                # Array Plot

# Ordinal Biclustering (additional)
plotFCBR_gg(result_ord)                 # Field Cumulative Boundary Reference (ordinal only)
LDB: Locally Dependent Biclustering
result_ldb <- LDB(J35S515, ncls = 6, nfld = 5)

plotFRP_gg(result_ldb)         # Field Reference Profile
plotTRP_gg(result_ldb)         # Test Reference Profile
plotLRD_gg(result_ldb)         # Latent Rank Distribution
plotRMP_gg(result_ldb)         # Rank Membership Profile
plotArray_gg(result_ldb)       # Array Plot
plotFieldPIRP_gg(result_ldb)   # Field Parent Item Reference Profile
plotGraph_gg(result_ldb)       # DAG per rank
BINET: Bayesian Network and Test
result_binet <- BINET(J35S515, ncls = 6, nfld = 5)

plotFRP_gg(result_binet)       # Field Reference Profile
plotTRP_gg(result_binet)       # Test Reference Profile
plotLRD_gg(result_binet)       # Latent Rank Distribution
plotRMP_gg(result_binet)       # Rank Membership Profile
plotArray_gg(result_binet)     # Array Plot
plotGraph_gg(result_binet, show_edge_label = TRUE)  # DAG with edge labels
BNM / LDLRA: DAG Visualization (plotGraph_gg)
result_bnm <- BNM(J15S500)
plotGraph_gg(result_bnm)

result_ldlra <- LDLRA(J15S500, ncls = 5)
plotGraph_gg(result_ldlra)     # One DAG per rank
Function-Model Compatibility
IRT / GRM
| Function |
IRT |
GRM |
| plotICC_gg |
x |
|
| plotICC_overlay_gg |
x |
|
| plotIIC_gg |
x |
x |
| plotIIC_overlay_gg |
x |
x |
| plotTIC_gg |
x |
x |
| plotTRF_gg |
x |
|
| plotICRF_gg |
|
x |
LCA / LRA / LRAordinal / LRArated
| Function |
LCA |
LRA |
LRAordinal |
LRArated |
| plotIRP_gg |
x |
x |
|
|
| plotFRP_gg |
x |
x |
|
|
| plotTRP_gg |
x |
x |
|
|
| plotLCD_gg |
x |
|
|
|
| plotLRD_gg |
|
x |
|
|
| plotCMP_gg |
x |
|
|
|
| plotRMP_gg |
|
x |
x |
x |
| plotScoreFreq_gg |
|
|
x |
x |
| plotScoreRank_gg |
|
|
x |
x |
| plotICRP_gg |
|
|
x |
x |
| plotICBR_gg |
|
|
x |
|
Biclustering / IRM
| Function |
Bic. |
nomBic. |
ordBic. |
IRM |
| plotFRP_gg |
x |
x |
x |
x |
| plotTRP_gg |
x |
|
|
x |
| plotLCD_gg |
x |
x |
x |
|
| plotLRD_gg |
x |
x |
x |
|
| plotCMP_gg |
x |
x |
x |
|
| plotRMP_gg |
x |
|
x |
|
| plotCRV_gg |
x |
x |
x |
|
| plotRRV_gg |
x |
x |
x |
|
| plotArray_gg |
x |
x |
x |
x |
| plotFCRP_gg |
|
x |
x |
|
| plotFCBR_gg |
|
|
x |
|
| plotScoreField_gg |
|
x |
x |
|
Network Models (LDLRA / LDB / BINET / BNM)
| Function |
LDLRA |
LDB |
BINET |
BNM |
| plotIRP_gg |
x |
|
|
|
| plotFRP_gg |
|
x |
x |
|
| plotTRP_gg |
|
x |
x |
|
| plotLRD_gg |
x |
x |
x |
|
| plotRMP_gg |
x |
x |
x |
|
| plotArray_gg |
|
x |
x |
|
| plotFieldPIRP_gg |
|
x |
|
|
| plotGraph_gg |
x |
x |
x |
x |
Utility
| Function |
Description |
| combinePlots_gg |
Arrange multiple plots in a grid |
Common Plot Options
All plot functions support these customization options:
| Parameter |
Description |
Default |
title |
TRUE (auto), FALSE (none), or character string |
TRUE |
colors |
Color vector (colorblind-friendly default) |
auto |
linetype |
"solid", "dashed", "dotted", etc. |
"solid" |
show_legend |
Show/hide legend |
TRUE |
legend_position |
"right", "top", "bottom", "left" |
"right" |
Some functions have additional parameters:
| Parameter |
Functions |
Description |
stat |
plotFRP_gg, plotCRV_gg, plotRRV_gg |
"mean", "median", or "mode" for polytomous data |
style |
plotFCRP_gg |
"line" or "bar" |
show_labels |
plotRRV_gg |
Show value labels (uses ggrepel) |
Documentation