iClusterVB
Fast Integrative Clustering and Feature Selection for High Dimensional Data
A variational Bayesian approach for fast integrative clustering and feature selection, facilitating the analysis of multi-view, mixed type, high-dimensional datasets with applications in fields like cancer research, genomics, and more.
iClusterVB

iClusterVB allows for fast integrative clustering and feature selection for high dimensional data.
Using a variational Bayes approach, its key features - clustering of mixed-type data, automated determination of the number of clusters, and feature selection in high-dimensional settings - address the limitations of traditional clustering methods while offering an alternative and potentially faster approach than MCMC algorithms, making iClusterVB a valuable tool for contemporary data analysis challenges.
Installation
You can install iClusterVB from CRAN with:
install.packages("iClusterVB")
You can install the development version of iClusterVB from GitHub with:
# install.packages("devtools")
devtools::install_github("AbdalkarimA/iClusterVB")
iClusterVB - The Main Function
Mandatory arguments
-
mydata: A list of length R, where R is the number of datasets, containing the input data.- Note: For categorical data,
0’s must be re-coded to another, non-0value.
- Note: For categorical data,
-
dist: A vector of length R specifying the type of data or distribution. Options include: "gaussian" (for continuous data), "multinomial" (for binary or categorical data), and "poisson" (for count data).
Optional arguments
-
K: The maximum number of clusters, with a default value of 10. The algorithm will converge to a model with dominant clusters, removing redundant clusters and automating the process of determining the number of clusters. -
initial_method: The method for the initial cluster allocation, which the iClusterVB algorithm will then use to determine the final cluster allocation. Options include "VarSelLCM" (default) for VarSelLCM, "random" for a random sample, "kproto" for k-prototypes, "kmeans" for k-means (continuous data only), "mclust" for mclust (continuous data only), or "lca" for poLCA (categorical data only). -
VS_method: The feature selection method. The options are 0 (default) for clustering without feature selection and 1 for clustering with feature selection -
initial_cluster: The initial cluster membership. The default is NULL, which usesinitial_methodfor initial cluster allocation. If it is not NULL, it will overwrite the previous initial values setting for this parameter. -
initial_vs_prob: The initial feature selection probability, a scalar. The default is NULL, which assigns a value of 0.5. -
initial_fit: Initial values based on a previously fitted iClusterVB model (an iClusterVB object). The default is NULL. -
initial_omega: Customized initial values for feature inclusion probabilities. The default is NULL. If the argument is not NULL, it will overwrite the previous initial values setting for this parameter. IfVS_method = 1,initial_omegais a list of length R, and each element of the list is an array with dim=c(N,p[[r]])). N is the sample size and p[[r]] is the number of features for dataset r, r = 1,…,R. -
initial_hyper_parameters: A list of the initial hyper-parameters of the prior distributions for the model. The default is NULL, which assignsalpha_00 = 0.001, mu_00 = 0,
s2_00 = 100, a_00 = 1, b_00 = 1, kappa_00 = 1, u_00 = 1, v_00 = 1. These are $\boldsymbol{\alpha}_0, \mu_0, s^2_0, a_0, b_0, \boldsymbol{\kappa}_0, c_0, \text{and } d_0$ described in https://dx.doi.org/10.2139/ssrn.4971680. -
max_iter: The maximum number of iterations for the VB algorithm. The default is 200. -
early_stop: Whether to stop the algorithm upon convergence or to continue untilmax_iteris reached. Options are 1 (default) to stop when the algorithm converges, and 0 to stop only whenmax_iteris reached. -
per: Print information every "per" iteration. The default is 10. -
convergence_threshold: The convergence threshold for the change in ELBO. The default is 0.0001.
Simulated Data
We will demonstrate the clustering and feature selection performance of
iClusterVB using a simulated dataset comprising $N = 240$ individuals
and $R = 4$ data views with different data types. Two views were
continuous,and one was count – a setup commonly found in genomics data
where gene or mRNA expression (continuous), and DNA copy number (count)
are observed. The true number of clusters ($K$) was set to 4, with
balanced cluster proportions
($\pi_1 = 0.25, \pi_2 = 0.25, \pi_3 = 0.25, \pi_4 = 0.25$). Each data
view consisted of $p_r = 500$ features ($r = 1, \dots, 3$), totaling
$p = \sum_{r=1}^3 p_r = 1500$ features across all views. Within each
view, only 50 features (10%) were relevant for clustering, while the
remaining features were noise. The relevant features were distributed
across clusters as described in the table below:
| Data View | Cluster | Distribution |
|---|---|---|
| 1 (Continuous) | Cluster 1 | $\mathcal{N}(10, 1)$ (Relevant) |
| Cluster 2 | $\mathcal{N}(5, 1)$ (Relevant) | |
| Cluster 3 | $\mathcal{N}(-5, 1)$ (Relevant) | |
| Cluster 4 | $\mathcal{N}(-10, 1)$ (Relevant) | |
| $\mathcal{N}(0, 1)$ (Noise) | ||
| 2 (Continuous) | Cluster 1 | $\mathcal{N}(-10, 1)$ (Relevant) |
| Cluster 2 | $\mathcal{N}(-5, 1)$ (Relevant) | |
| Cluster 3 | $\mathcal{N}(5, 1)$ (Relevant) | |
| Cluster 4 | $\mathcal{N}(10, 1)$ (Relevant) | |
| $\mathcal{N}(0, 1)$ (Noise) | ||
| 3 (Count) | Cluster 1 | $\text{Poisson}(50)$ (Relevant) |
| Cluster 2 | $\text{Poisson}(35)$ (Relevant) | |
| Cluster 3 | $\text{Poisson}(20)$ (Relevant) | |
| Cluster 4 | $\text{Poisson}(10)$ (Relevant) | |
| $\text{Poisson}(2)$ (Noise) |
Distribution of relevant and noise features across clusters in each data view
The simulated dataset is included as a list in the package.
Data pre-processing
library(iClusterVB)

# Input data must be a list

dat1 <- list(gauss_1 = sim_data$continuous1_data,
             gauss_2 = sim_data$continuous2_data,
             multinomial_1 = sim_data$binary_data)

dist <- c("gaussian", "gaussian",
          "multinomial")
Running the model
set.seed(123)
fit_iClusterVB <- iClusterVB(
  mydata = dat1,
  dist = dist,
  K = 8,
  initial_method = "VarSelLCM",
  VS_method = 1, # Variable Selection is on
  max_iter = 100,
  per = 100
)
#> ------------------------------------------------------------
#> Pre-processing and initializing the model
#> ------------------------------------------------------------
#> ------------------------------------------------------------
#> Running the CAVI algorithm
#> ------------------------------------------------------------
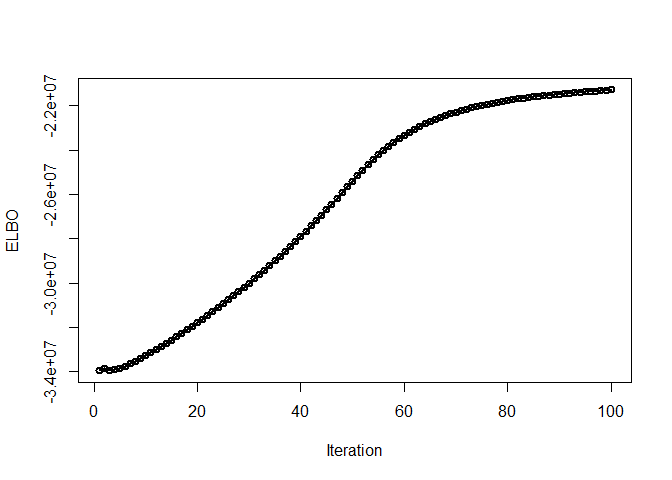
#> iteration = 100 elbo = -21293757.232508
Comparing to True Cluster Membership
table(fit_iClusterVB$cluster, sim_data$cluster_true)
#>
#>      1  2  3  4
#>   4  0  0 60  0
#>   5  0 60  0  0
#>   6  0  0  0 60
#>   8 60  0  0  0
Summary of the Model
# We can obtain a summary using summary()
summary(fit_iClusterVB)
#> Total number of individuals:
#> [1] 240
#>
#> User-inputted maximum number of clusters: 8
#> Number of clusters determined by algorithm: 4
#>
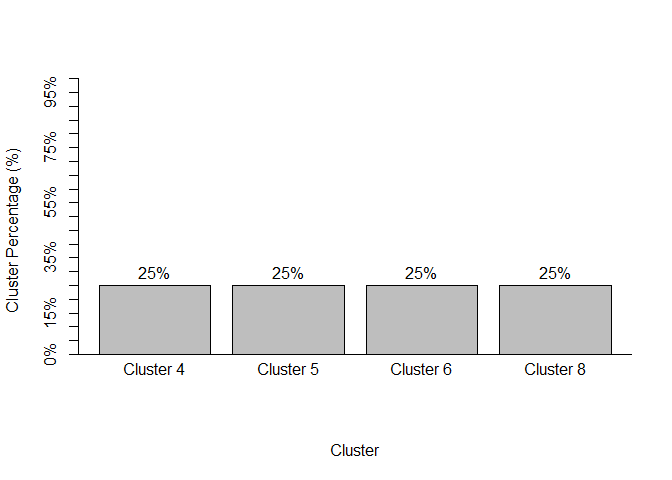
#> Cluster Membership:
#>  4  5  6  8
#> 60 60 60 60
#>
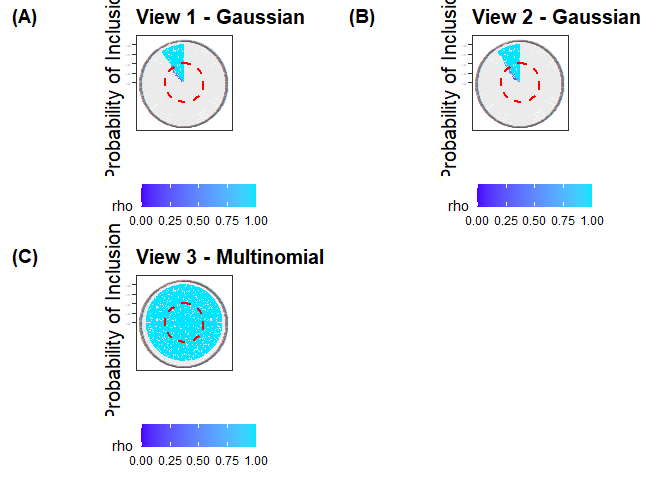
#> # of variables above the posterior inclusion probability of 0.5 for View 1 - gaussian
#> [1] "54 out of a total of 500"
#>
#> # of variables above the posterior inclusion probability of 0.5 for View 2 - gaussian
#> [1] "59 out of a total of 500"
#>
#> # of variables above the posterior inclusion probability of 0.5 for View 3 - multinomial
#> [1] "500 out of a total of 500"
Generic Plots
plot(fit_iClusterVB)
Probability of Inclusion Plots
# The `piplot` function can be used to visualize the probability of inclusion

piplot(fit_iClusterVB)
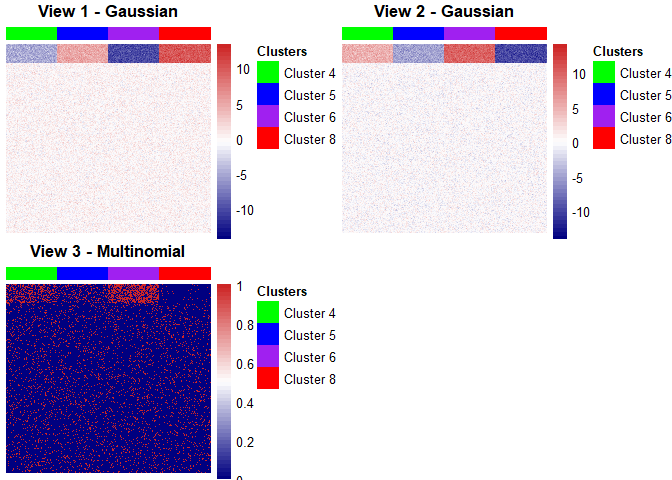
Heat maps to visualize the clusters
# The `chmap` function can be used to display heat maps for each data view

list_of_plots <- chmap(fit_iClusterVB, rho = 0,
      cols = c("green", "blue",
               "purple", "red"),
      scale = "none")
# The `grid.arrange` function from gridExtra can be used to display all the
# plots together
gridExtra::grid.arrange(grobs = list_of_plots, ncol = 2, nrow = 2)