idendr0
Interactive Dendrograms
Interactive dendrogram that enables the user to select and color clusters, to zoom and pan the dendrogram, and to visualize the clustered data not only in a built-in heat map, but also in 'GGobi' interactive plots and user-supplied plots. This is a backport of Qt-based 'idendro' (< https://github.com/tsieger/idendro>) to base R graphics and Tcl/Tk GUI.
idendr0
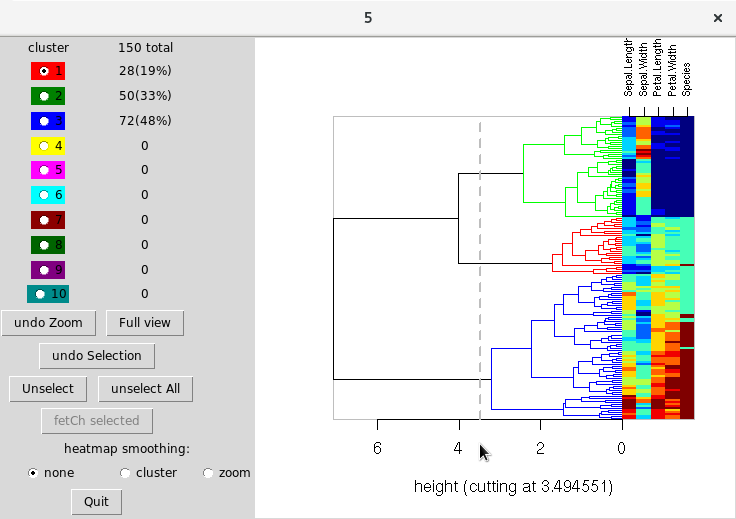
'idendr0' is an interactive dendrogram that enables the user to select and color clusters, to zoom and pan the dendrogram, and to visualize the clustered data not only in a built-in heat map, but also in GGobi interactive plots and user-supplied plots.
idendr0 is a backport of idendro to base R graphics and Tcl/Tk GUI.
Documentation
A paper in the Journal of Statistical Software and idendro vignette.
To install:
- the latest released version:
install.packages("idendr0") - the latest development version:
devtools::install_github("tsieger/idendr0")
A simple example:
library(idendr0)
hc <- hclust(dist(iris[, 1:4]))
idendro(hc, iris)
Integration with other plots
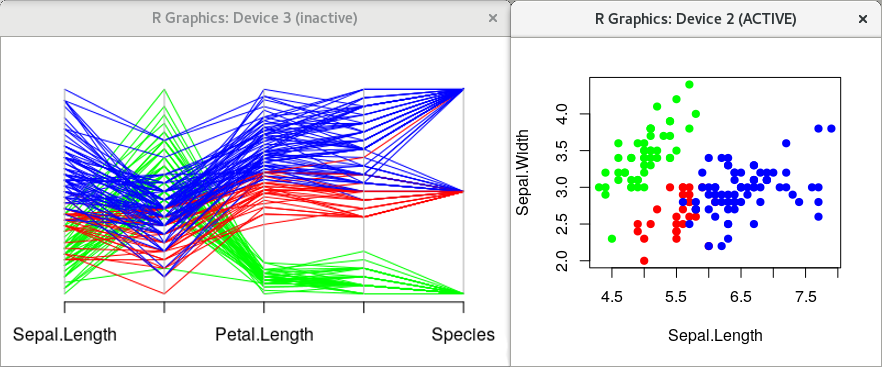
Please see demo(idendroWithScatterAndParcoord),
which, in addition to the dendrogram, creates two feature space plots:
For more demos, please run demo(package="idendr0")'.
Find out more at https://github.com/tsieger/idendr0.