sapfluxnetr
Working with 'Sapfluxnet' Project Data
Access, modify, aggregate and plot data from the 'Sapfluxnet' project, the first global database of sap flow measurements.
sapfluxnetr

sapfluxnetr provides tools for a tidy data analysis for the first
global database of sap flow measurements
Examples
You can work with individual sites:
# load packages
library(sapfluxnetr)
library(ggplot2)

# ARG_MAZ example site data
data('ARG_MAZ', package = 'sapfluxnetr')
data('sfn_metadata_ex', package = 'sapfluxnetr')

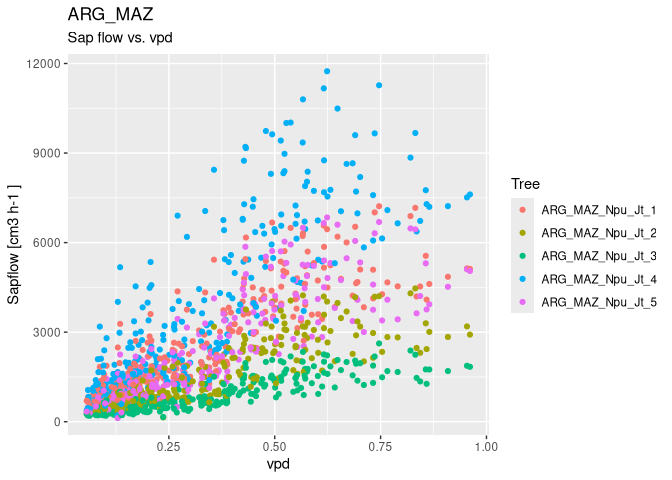
# plot site sapflow measurements versus vpd
sfn_plot(ARG_MAZ, formula_env = ~ vpd)
# daily sapflow and environmental metrics
arg_maz_metrics <- daily_metrics(
  ARG_MAZ, tidy = TRUE, metadata = sfn_metadata_ex
)
#> [1] "Crunching data for ARG_MAZ. In large datasets this could take a while"
#> [1] "General data for ARG_MAZ"

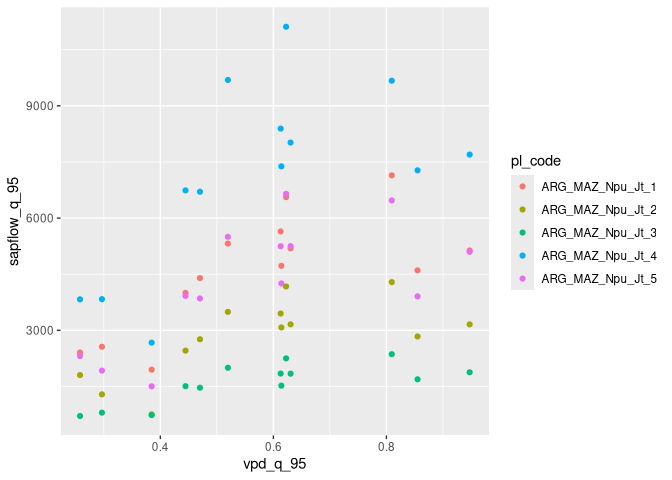
# plot daily aggregations
ggplot(arg_maz_metrics, aes(x = vpd_q_95, y = sapflow_q_95, colour = pl_code)) +
  geom_point()
You can work with multiple sites also:
# ARG_TRE and AUS_CAN_ST2_MIX example sites
data('ARG_TRE', package = 'sapfluxnetr')
data('AUS_CAN_ST2_MIX', package = 'sapfluxnetr')
multi_sfn <- sfn_data_multi(ARG_TRE, ARG_MAZ, AUS_CAN_ST2_MIX)

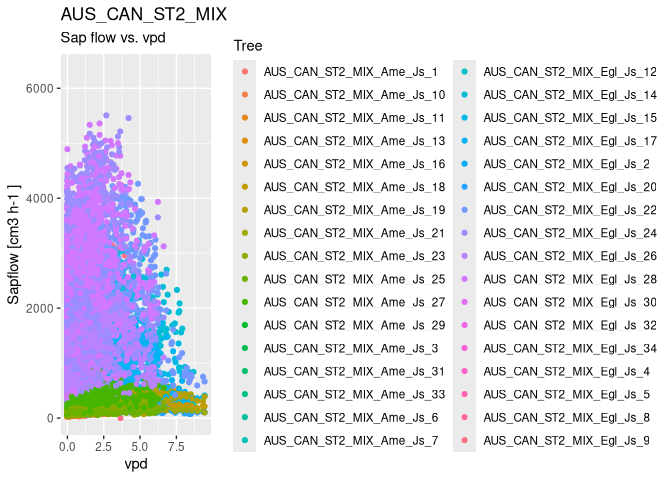
# plotting the individual sites. It creates a list of plots
plots_list <- sfn_plot(multi_sfn, formula_env = ~ vpd)
plots_list[['AUS_CAN_ST2_MIX']]
#> Warning: Removed 526066 rows containing missing values or values outside the scale range
#> (`geom_point()`).
# daily sapflow standard metrics
multi_metrics <- daily_metrics(
  multi_sfn, tidy = TRUE, metadata = sfn_metadata_ex
)
#> [1] "Crunching data for ARG_TRE. In large datasets this could take a while"
#> [1] "General data for ARG_TRE"
#> [1] "Crunching data for ARG_MAZ. In large datasets this could take a while"
#> [1] "General data for ARG_MAZ"
#> [1] "Crunching data for AUS_CAN_ST2_MIX. In large datasets this could take a while"
#> [1] "General data for AUS_CAN_ST2_MIX"

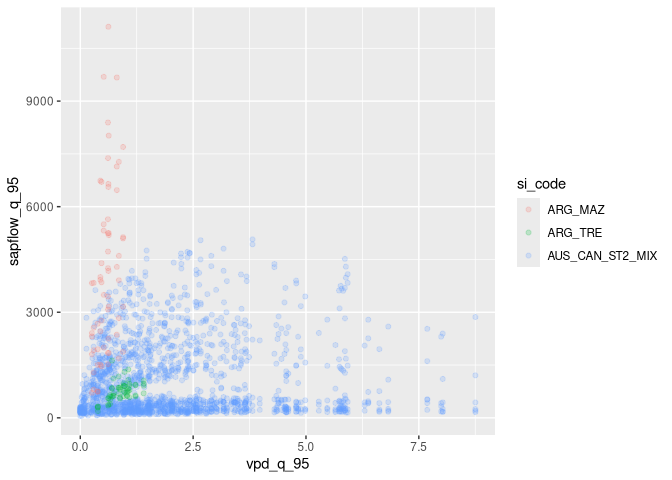
# plot daily aggregations
ggplot(multi_metrics, aes(x = vpd_q_95, y = sapflow_q_95, colour = si_code)) +
  geom_point(alpha = 0.2)
#> Warning: Removed 10966 rows containing missing values or values outside the scale range
#> (`geom_point()`).
Installation
You can install sapfluxnetr from CRAN:
install.packages('sapfluxnetr')
Be advised, sapfluxnetr is in active development and can contain
undiscovered bugs. If you find something not working as expected fill a
bug at https://github.com/sapfluxnet/sapfluxnetr/issues
Overview
Please see
vignette('sapfluxnetr-quick-guide', package = 'sapfluxnetr') for a
detailed overview of the package capabilities.