b3gbi
General Biodiversity Indicators for Biodiversity Data Cubes
Calculate general biodiversity indicators from species
occurrence cubes, such as those produced by the 'GBIF' (Global
Biodiversity Information Facility) occurrence cube service
< https://techdocs.gbif.org/en/data-use/data-cubes>. Indicators include
observed and coverage-based rarefied species richness and Hill numbers
(via 'iNEXT'), evenness, rarity, taxonomic distinctness, occupancy,
turnover and sample completeness, and can be calculated over time (time
series) or space (maps), with bootstrap confidence intervals. Cubes using
the EEA reference grid, MGRS, the extended quarter-degree grid (EQDGC) or
ISEA3H grids are supported. For details see Dove (2026)
b3gbi 


Analyze biodiversity trends and spatial patterns from GBIF data cubes, using flexible indicators like richness, evenness, and more.
Overview
Biodiversity researchers need robust and standardized tools to analyze the vast amounts of data available on platforms like GBIF. The b3gbi package leverages the power of data cubes to streamline biodiversity assessments. It helps researchers gain insights into:
- Changes Over Time: How biodiversity metrics shift throughout the years.
- Spatial Variations: Differences in biodiversity across regions, identifying hotspots or areas of concern.
- The Impact of Factors: How different environmental variables or human activities might affect biodiversity patterns.
Key Features
b3gbi empowers biodiversity analysis with:
- Standardized Workflows: Simplify the process of calculating common biodiversity indicators from GBIF data cubes.
- Flexibility: Calculate richness, evenness, rarity, taxonomic distinctness, Hill-Shannon diversity, Hill-Simpson diversity, completeness, and more.
- Analysis Options: Explore temporal trends or create spatial maps.
- Visualization Tools: Generate publication-ready plots of your biodiversity metrics.
Installation
Install b3gbi in R:
install.packages("b3gbi", repos = c("https://b-cubed-eu.r-universe.dev", "https://cloud.r-project.org"))
Example: Three-Step Workflow
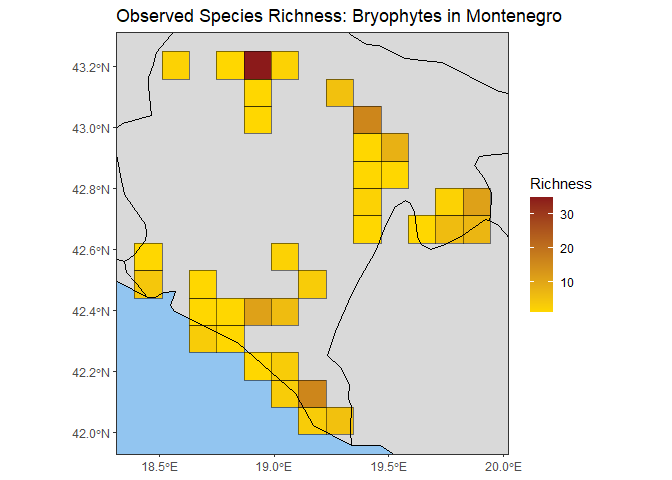
This basic example demonstrates the core workflow: preparing the data cube, calculating an indicator, and plotting the result as a spatial map of species richness for bryophytes in Montenegro.
# Load package
library(b3gbi)

# 1. Load and prepare the GBIF data cube
cube_name <- system.file("extdata", "montenegro_bryophytes_cube_eea.csv", package = "b3gbi")
bryophyte_data <- process_cube(cube_name)

# 2. Calculate a map of observed richness
map_rich_bryo <- obs_richness_map(bryophyte_data, level = "country", region = "Montenegro", ne_scale = "medium", cell_size = 10)

# 3. Plot the indicator map
plot(map_rich_bryo, title = "Observed Species Richness: Bryophytes in Montenegro")
For a more in-depth introduction, see the tutorial: https://b-cubed-eu.github.io/b3gbi/articles/b3gbi.html.