reactable
Interactive Data Tables for R
Interactive data tables for R, based on the 'React Table' JavaScript library. Provides an HTML widget that can be used in 'R Markdown' or 'Quarto' documents, 'Shiny' applications, or viewed from an R console.
reactable



Interactive data tables for R, based on the React Table library and made with reactR.
Features
- Sorting, filtering, pagination
- Grouping and aggregation
- Built-in column formatting
- Custom rendering via R or JavaScript — use Shiny HTML tags and HTML widgets in tables
- Expandable rows and nested tables
- Conditional styling
- Works seamlessly within R Markdown documents and Shiny apps
Demos
- Twitter Followers
- Women's World Cup Predictions
- NBA Box Score
- CRAN Packages
- Spotify Charts
- Popular Movies
- Demo Cookbook
- 100k Rows
- Shiny Demo
Installation
You can install reactable from CRAN with:
install.packages("reactable")
Or install the development version from GitHub with:
# install.packages("devtools")
devtools::install_github("glin/reactable")
Usage
To create a table, use reactable() on a data frame or matrix:
library(reactable)

reactable(iris)
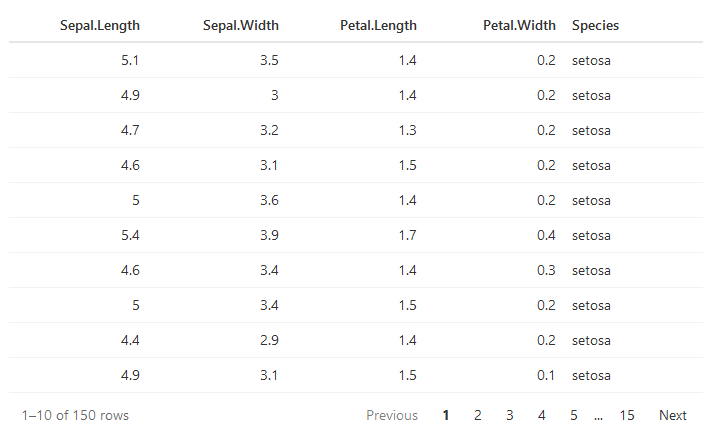
You can embed tables in R Markdown or Quarto documents:
```{r}
library(reactable)

reactable(iris)
```
Or use them in Shiny applications:
library(shiny)
library(reactable)

ui <- fluidPage(
  reactableOutput("table")
)

server <- function(input, output) {
  output$table <- renderReactable({
    reactable(iris)
  })
}

shinyApp(ui, server)
To learn more about using reactable, check out the examples below.
Examples
- Basic Usage
- Sorting
- Filtering
- Searching
- Pagination
- Grouping and Aggregation
- Column Formatting
- Custom Rendering
- Embedding HTML Widgets
- Footers and Total Rows
- Expandable Rows and Nested Tables
- Conditional Styling
- Table Styling
- Theming
- Column Groups
- Column Resizing
- Sticky Columns
- Row Names and Row Headers
- Cell Click Actions
- Language Options
- Shiny
- Cross-Widget Interactions with Crosstalk
- JavaScript API
Browser Support
 IE / Edge |
 Firefox |
 Chrome |
 Safari |
 Opera |
|---|---|---|---|---|
| IE 11*, Edge | last 2 versions | last 2 versions | last 2 versions | last 2 versions |
* Support for Internet Explorer 11 was deprecated in reactable v0.4.0.
License
MIT